

TL;DR: Snort is a free, open-source, and highly powerful network intrusion detection and prevention system (IDS/IPS) that analyzes network traffic in real-time to detect and block malicious activity. It was created in 1998 by Martin Roesch and grew into the de facto standard for intrusion detection, with over 4 million downloads, nearly 400,000 registered users, and added enterprise backing after Cisco acquired Sourcefire for $2.7 billion in 2013 (Snort background and history)).
Snort is a free, open-source, and highly powerful network intrusion detection and prevention system (IDS/IPS) that analyzes network traffic in real-time to detect and block malicious activity.
Introduction Securing Your Digital Front Door
At 2:00 a.m., a customer-facing server starts taking a burst of odd requests. The firewall allows the traffic because the ports are supposed to be open. CPU climbs, application logs get noisy, and the team still cannot answer the first operational question that matters. Is this normal traffic, a scan, or the start of an attack?
That visibility gap is where many hosting deployments get exposed. A VPS, bare metal node, or private cloud stack can be patched, backed up, and filtered at the perimeter, yet still leave security teams blind to what is crossing the network. By the time the problem shows up in the application, you are already in response mode instead of detection mode.
Snort is still relevant because it gives defenders packet-level visibility and rule-based detection they can use in production. It began in 1998 as a lightweight packet sniffer created by Martin Roesch and later became one of the best-known names in intrusion detection. Cisco’s acquisition of Sourcefire confirmed its long-term market value, but the practical reason engineers keep deploying Snort is simpler. It works, provided you place it correctly, tune it carefully, and support it with the right operating model.
That last part gets missed in many introductions. Snort is not hard to install. Running it well on modern hosting infrastructure is the main challenge. You need to decide where to inspect traffic, how to handle false positives, how to maintain rules without breaking production, and how to connect alerts to firewall policy, logging, and incident response. Teams reviewing Linux firewall policy and filtering strategy usually reach the same conclusion. Inspection only helps if it fits the rest of the control stack.
This article takes that operational view. The goal is not only to answer what Snort software is, but to explain how to run it effectively on infrastructure that has uptime requirements, limited staff time, and real exposure to internet traffic. That is also where managed hosting and security support from providers such as ARPHost close the gap between a free open-source engine and an enterprise-grade security posture.
Security teams that treat network monitoring as one layer in a wider program usually get better results than teams that deploy a sensor and hope for coverage. If your organization is tightening policy, user awareness, and technical controls at the same time, this essential guide to workplace cybersecurity is a useful companion read.
Understanding Snort Core Concepts and Components
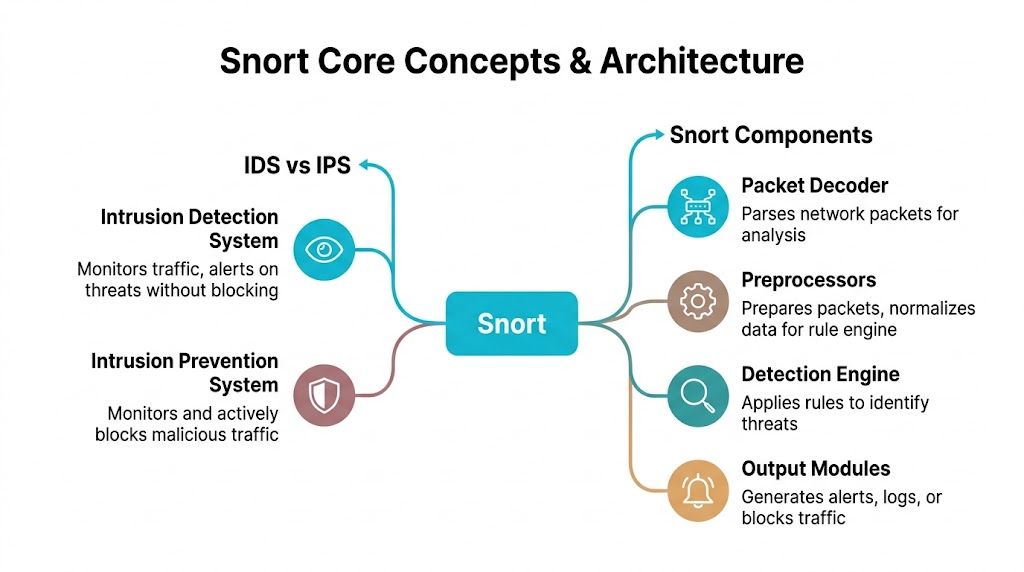
Snort makes more sense once you separate two roles that often get blended together: detection and prevention.
An IDS watches traffic and raises alerts. An IPS sits inline and can actively block traffic. The practical analogy is simple. An IDS is a security camera and alarm. An IPS is a security gate that can lock when it sees a problem.
IDS mode versus IPS mode
In IDS mode, Snort monitors passively. It inspects packets, compares them against rules, and logs or alerts on matches. This is the safer starting point because it won’t interrupt production traffic while you tune rules.
In IPS mode, Snort is deployed inline and can drop or block malicious packets. That gives you active defense, but it also raises the stakes. A bad rule in IPS mode can block legitimate traffic just as effectively as it blocks an attack.
For teams already reviewing packet filtering and host-level enforcement, this roundup of Linux firewall guidance is a useful companion because Snort works best when you understand where packet inspection sits relative to firewall policy.
The three Snort operating modes
Snort isn’t one single behavior. It has three primary operating modes, and each serves a different operational need.
- Packet sniffer mode reads traffic live, similar to a packet analyzer.
- Packet logger mode records packets for later review and troubleshooting.
- Full IDS or IPS mode applies rules and generates alerts or blocking actions.
That flexibility is one reason Snort remained useful across Unix, Linux, and Windows environments. It can start as a diagnostic tool and later become a formal detection layer.
The internal components that matter
Snort’s architecture is easier to manage when you think of it as a pipeline.
| Component | What it does | Why it matters |
|---|---|---|
| Packet Decoder | Parses captured packets into a form Snort can analyze | If parsing fails, detection quality drops immediately |
| Preprocessors | Normalizes and prepares traffic before rule evaluation | Helps catch evasions and odd protocol behavior |
| Detection Engine | Applies rules to packets and sessions | This is where signatures and logic actually fire |
| Output Modules | Sends alerts, logs, or actions | Determines whether events become useful operations data |
Preprocessors deserve special attention. Newer admins often focus only on rules, but preprocessors influence whether traffic is normalized correctly before the rule engine sees it. If your HTTP traffic, fragmentation behavior, or stream handling isn’t aligned with reality, your alert quality suffers.
Operational takeaway: The rule set gets most of the attention, but packet handling and preprocessing often decide whether Snort is noisy or trustworthy.
Why this matters in production
A lot of “what is snort software” explainers stop at “it detects attacks.” That’s too shallow for real hosting environments. In practice, Snort is a modular inspection framework. You feed it packets, shape how it interprets them, define what matters, and decide how aggressively it should respond.
That’s exactly why it can fit very different use cases. One team may run it as a passive sensor on a public web node. Another may place it inline in front of critical workloads. The tool is the same. The operational model is not.
How Snort Inspects Traffic and Detects Threats
A Snort sensor lives or dies on packet quality. If the host drops traffic, if the NIC is overloaded, or if session reassembly is off, the cleanest ruleset in the world will still miss activity you care about.

The packet path inside Snort
Once traffic reaches the sensor, Snort captures packets through libpcap and pushes them into its inspection pipeline. On a lightly loaded VPS, that can be straightforward. On a busy bare metal host or private cloud edge, capture method, CPU headroom, memory allocation, and queue tuning all affect whether Snort sees enough traffic to make reliable decisions.
OpenWrt’s Snort documentation notes that memory use rises with rule volume, modest systems can handle lower-throughput deployments with tuning, and high-speed setups may rely on DAQ options designed for more efficient packet handling (Snort performance, memory, and packet capture notes).
That trade-off matters in production. More rules can improve coverage, but they also raise inspection cost. If you push Snort past what the host can sustain, packet loss becomes an operational blind spot, not a theoretical concern.
A practical example of a Snort rule
A rule tells Snort what traffic to inspect, what pattern matters, and what action to record.
alert tcp any any -> $HOME_NET 80 (msg:"Possible SQL injection attempt"; content:"' OR 1=1"; sid:1000001;)
Here’s what each part does:
- alert tells Snort to generate an alert when the rule matches
- tcp limits the rule to TCP traffic
- any any means any source address and any source port
- -> $HOME_NET 80 points the rule at traffic going to your protected network on port 80
- msg creates the human-readable alert text
- content looks for a specific payload pattern
- sid gives the rule a unique identifier
This rule is intentionally basic. Real production rules usually add flow state, protocol context, offset and depth limits, and more precise matching so an analyst is not chasing harmless strings buried in normal application traffic.
Write rules narrowly. Broad content matches look fine in a lab and turn into alert fatigue on live systems.
Detection methods Snort uses
Snort uses several detection methods at the same time, which is why it remains useful well beyond simple string matching.
- Signature-based detection matches known malicious patterns in payloads and sessions.
- Protocol analysis checks whether traffic behavior fits protocol expectations.
- Anomaly-aware inspection helps identify malformed or suspicious behavior that falls outside normal structure.
In real hosting environments, that mix is what lets Snort catch different classes of activity. A public web server may show exploit payloads in HTTP requests. A mail node may show protocol misuse. An exposed management interface may see scan behavior before an attacker ever reaches an application login page.
Before you tune alerts around those services, confirm what is exposed. This guide to checking whether a port is open on Linux is a useful first pass during rollout, especially on VPS and private cloud workloads where service exposure changes faster than teams expect.
Why ruleset quality matters more than people think
Rule quality decides whether Snort becomes a trusted sensor or another noisy log source. Community rules are a reasonable starting point, but production environments usually need tuning, suppression, variable cleanup, and regular updates tied to the services you operate.
That is one of the biggest gaps between downloading Snort and operating it well. Teams running ecommerce platforms, customer portals, APIs, or admin services need current rules, clean alert routing, and someone accountable for tuning. Managed hosting providers that understand Snort operations can close that gap by handling the platform work around the engine itself. ARPHost fits that model by pairing the open-source tool with infrastructure, maintenance, and operational support that smaller teams often lack.
What works and what doesn’t
What works:
- Passive IDS deployment first
- Focused rules for public-facing services
- Environment-specific tuning
- Alert forwarding into a central log workflow
What doesn’t:
- Enabling large rulesets without pruning
- Treating every alert as equally urgent
- Running inline blocking before baselining traffic
- Assuming packet inspection alone explains application problems
Snort produces the best results when the sensor is sized correctly, the rules match the workload, and someone is actively tuning it. That is the difference between installing a free IDS and running a detection layer you can trust.
Practical Deployment Scenarios and Best Practices
Snort deployment is not one size fits all. A single VPS, a busy dedicated host, and a virtualized cluster each need different sensor placement, resource planning, and tuning.

Get the placement wrong, and you either miss traffic or overload the host.
Scenario one running Snort on a VPS
A VPS works well for a focused IDS deployment on a single public workload. Typical examples include a WordPress instance, a small Magento store, a mail relay, or a custom application server with a narrow attack surface.
The key trade-off is visibility versus overhead. On a VPS, Snort shares CPU, memory, and disk I/O with the workload it is watching. That makes it a practical starting point, but it also means you need to keep the ruleset tight and monitor resource pressure during traffic spikes.
A clean rollout usually follows this order:
- Install Snort from the package manager or your preferred build method.
- Set the interface and network variables in
snort.conf. - Enable rules that match the services exposed to the internet.
- Start in IDS mode and collect alerts before considering inline action.
- Review alert volume, suppress noise, and confirm the sensor is seeing the traffic you care about.
A minimal command flow on Linux often looks like this:
sudo apt update
sudo apt install snort
sudo snort -T -c /etc/snort/snort.conf
sudo snort -A console -q -c /etc/snort/snort.conf -i eth0
The -T test matters in production. It catches broken includes, variable mistakes, and rule syntax problems before you waste time debugging a sensor that never started correctly.
For smaller teams, this is usually the best first step. It gives you useful packet inspection without redesigning the whole network.
Scenario two using bare metal for heavier inspection
Bare metal is the better fit when inspection is expected to stay reliable under sustained load. If the host is already serving production traffic at high volume, adding Snort to the same box creates avoidable contention and packet drops.
This matters more than many deployments admit. Snort can inspect traffic quickly, but deep packet inspection still consumes CPU and memory, and packet capture quality falls apart if the sensor is starved. On a dedicated server, you can reserve resources for inspection, separate management from monitored interfaces, and keep troubleshooting simpler.
Use bare metal when:
- Traffic stays busy for long periods: Packet loss becomes a real detection problem, not a theoretical one.
- Rulesets are broader: More protocol coverage increases memory use and inspection cost.
- Inline mode is being tested: Blocking needs predictable performance and clean rollback options.
- Retention and forensics matter: Local logs, packet captures, and supporting telemetry are easier to manage on dedicated infrastructure.
If Snort is tied to customer-facing revenue, dedicated hardware is often the safer call.
Scenario three monitoring a Proxmox private cloud
Private cloud deployments create a different problem. Internet-bound traffic is only part of the story. Lateral movement between VMs, admin interfaces, storage networks, and internal APIs may never cross the same inspection point unless you design for it.
In Proxmox environments, I usually see three workable models:
| Placement model | Best use | Trade-off |
|---|---|---|
| Per-VM sensor | Isolated high-value workloads | More agents and more configuration sprawl |
| Virtual bridge monitoring | Shared visibility across tenant or cluster segments | Requires careful planning around interfaces and mirrored traffic |
| Dedicated security VM | Centralized inspection for selected segments | Easier management, but depends on traffic being routed or mirrored correctly |
The dedicated sensor VM is often the most manageable option for private cloud hosting. It centralizes updates, keeps policy changes in one place, and fits well with managed environments. The catch is traffic engineering. If the right bridges are not mirrored or routed through the sensor, Snort will look healthy while missing the traffic that matters.
Here’s a common test pattern for a Proxmox-hosted sensor:
sudo snort -T -c /etc/snort/snort.conf
sudo systemctl enable snort
sudo systemctl start snort
sudo tail -f /var/log/snort/alert
Service status is only the first check. Confirm interface visibility, generate controlled test traffic, and verify the alerts match the segment you intended to monitor.
A good companion reference during planning is this walkthrough video:
The operational work that usually gets underestimated
Snort is free to download. Operating it well is a staffing and process question.
The recurring failure point is not installation. It is ownership. Someone has to maintain rule coverage, verify packet visibility after network changes, tune noisy signatures, and connect alerts to an actual response process. Teams that skip that work end up with a sensor that runs for months without producing trusted output.
That gap is why hosted and managed environments matter. On VPS fleets, dedicated servers, or private cloud nodes, the core value often comes from pairing Snort with disciplined infrastructure management and a layered security design, not from the engine alone. A practical model is to place Snort inside a broader layered hosting security strategy and pair network alerts with endpoint telemetry such as Endpoint Detection and Response (EDR).
Common breakdowns look like this:
- Alert fatigue: Too many generic rules, not enough tuning.
- Missing asset context: Analysts cannot tell whether the destination system is low-risk or business-critical.
- Stale policy: The application stack changed, but thresholds, suppressions, and HOME_NET definitions did not.
- No response owner: Alerts exist, but nobody is responsible for validating and acting on them.
Managed support changes the outcome. Providers such as ARPHost can handle the hosting layer, sensor health, update cadence, and operational consistency that smaller in-house teams often struggle to maintain.
Best practices that hold up in production
The strongest Snort deployments are boring in the right ways. They are predictable, tuned to the environment, and reviewed after changes.
Use these habits:
- Start in IDS mode: Establish normal traffic patterns before testing blocking actions.
- Match rules to exposed services: Public web apps, mail systems, and internal APIs do not need the same detection profile.
- Keep the sensor separate when possible: Inspection quality improves when it is not fighting with the production workload for resources.
- Test after infrastructure changes: New reverse proxies, plugins, VLAN changes, and bridge updates can compromise visibility.
- Treat tuning as ongoing work: A good sensor gets reviewed regularly, especially after application releases or traffic shifts.
Snort earns its place when it is run like an operational security control. In modern hosting, that usually means combining the open-source engine with disciplined deployment patterns and managed oversight that keep detection accurate over time.
Integrating Snort into Your Security Ecosystem
Snort alerts by themselves are rarely enough. A single packet match can tell you something suspicious happened, but it usually can’t tell you whether that event mattered, whether it spread, or whether the same indicator appears elsewhere in your environment.
Centralize the logs or lose the value
The first integration that matters is log forwarding. Snort can alert to syslog, files, and other output paths, but production teams usually need those alerts in a central analysis system. That might be ELK, Graylog, or another SIEM platform that can correlate network events with server logs, authentication records, and application behavior.
Once events are centralized, patterns become visible. A burst of suspicious requests on a web server starts to matter more when the same source also triggered login anomalies or outbound connection attempts elsewhere.
A layered model is the right way to think about this. This guide on security in layers is useful because it frames the exact operational truth that Snort alone can’t cover every attack path.
Pair network visibility with endpoint context
Network inspection sees movement on the wire. It doesn’t automatically tell you what happened inside the host after that traffic landed.
That’s where endpoint tooling matters. If you want a practical complement to network IDS, this overview of Endpoint Detection and Response (EDR) is worth reading because it explains how endpoint telemetry fills the visibility gap that network-only monitoring leaves behind.
A high-confidence security workflow usually needs both perspectives. Network evidence tells you what reached the host. Endpoint evidence tells you what executed.
Automate response carefully
The next step is response orchestration. A mature setup can take a validated Snort alert and trigger downstream action, such as:
- Firewall enforcement: Add a temporary block for a known abusive source.
- Ticket creation: Open an incident automatically with alert context attached.
- Host isolation workflow: Escalate for endpoint containment if correlated evidence supports it.
- Analyst enrichment: Pull recent related logs so the responder starts with context, not guesswork.
Automation helps most when it’s selective. If you tie every medium-confidence signature directly to a block rule, you’ll create self-inflicted outages. Start by automating enrichment, then low-risk containment, then stricter actions only after repeated validation.
The practical architecture
A simple and effective chain looks like this:
- Snort inspects traffic and generates events.
- Logs move into a centralized platform.
- Correlation logic checks whether the same source, host, or pattern appears elsewhere.
- Analysts or automation decide whether to suppress, monitor, or block.
- Findings feed back into rule tuning.
That feedback loop is where Snort stops being a noisy sensor and becomes a useful control.
Snort Pros Cons and Real-World Limitations
Snort has stayed relevant for a reason. It’s open-source, mature, flexible, and capable of running in very different environments without forcing a proprietary architecture decision. It can function as a packet sniffer, a logger, a full IDS, or an inline IPS. For many teams, that combination is exactly what makes it worth learning.
Where Snort is strong
Its biggest strength is control. You decide where to deploy it, what to inspect, which rules matter, and how aggressive the response should be. That makes Snort useful for engineers who want a transparent system instead of a black box.
It’s also well suited to environments where public-facing services need close observation without forcing an all-in security platform purchase. If you already understand your network and can maintain the sensor properly, Snort can deliver very strong value.
Where teams struggle
The downsides are operational, not theoretical. Snort needs tuning. Rules need care. Alert handling needs process. If those pieces are weak, even good detection logic turns into noise.
The second challenge is performance planning. Inspection takes resources, and inspection quality falls when the host is overloaded or when the deployment path doesn’t expose the right traffic to the sensor.
Hard truth: Free software can still be expensive when your team has to absorb the engineering, monitoring, and tuning burden.
The modern limitation that matters most
Encrypted traffic is the largest blind spot. Snort can’t inspect encrypted payloads unless you add complex and resource-intensive SSL or TLS decryption. With over 90% of web traffic now encrypted, Snort often has to rely on metadata instead of full payload visibility, which means complex polymorphic threats and advanced persistent threats can hide inside encrypted channels more easily (Snort limitations with encrypted traffic).
That limitation changes how you should use Snort. It’s still valuable, but it cannot be your only detection layer. You need supporting controls at the endpoint, application, authentication, and web protection layers.
The practical conclusion
Snort is not obsolete. It’s also not magic.
Use it when you want strong network-level inspection, rule-driven control, and flexible deployment. Don’t rely on it alone for modern attack detection, especially where encrypted traffic dominates. The best real-world use of Snort is as one layer in a defense strategy that also includes endpoint monitoring, hardened hosting, application security, and disciplined operations.
Why ARPHost Excels for Snort Deployments
Snort works best on infrastructure you can shape around the sensor. That means choosing hosting that gives you control over packet paths, interface access, resource allocation, and log handling. ARPHost, LLC stands out here because its service options map cleanly to the way Snort is deployed in production, not just in lab demos.
A small rollout usually starts with a single exposed service and a narrow detection goal. A VPS can support that model if the traffic volume is modest and the team understands the visibility limits of a virtualized environment. For higher-throughput inspection, dedicated sensors, or stricter separation between production workloads and security tooling, bare metal is usually the better choice. Private cloud setups also matter when you need to inspect traffic between segmented applications instead of watching only north-south internet traffic.
That infrastructure fit matters more than many teams expect.
The other reason ARPHost is a strong match is operational range. Snort deployment is rarely the hard part. The actual work starts after the rules are loaded. Someone has to validate alerts, tune noisy signatures, manage updates, retain logs, and decide when prevention actions are safe. ARPHost can support both ends of that spectrum. Teams that want direct control can run Snort themselves on hosting built for that level of access. Teams that need help keeping the system useful over time can fold it into a managed operating model instead of letting the sensor drift into a noisy, ignored control.
That changes the outcome. A Snort instance with poor tuning creates alert fatigue. A Snort instance backed by stable infrastructure and ongoing administration becomes a dependable detection layer.
ARPHost also fits organizations that are building a broader hosting security baseline, not just dropping in one IDS process and hoping for coverage. That matters in real environments where Snort has to coexist with hardened workloads, access controls, backup policies, patching schedules, and incident response procedures. The result is a deployment that behaves like part of a security program, not a side project.
Conclusion Your Next Steps for Network Security
Snort is still a practical answer for teams asking what Snort software is and whether it belongs in a real security program. It gives you packet visibility, rule-based detection, and the option to block traffic when you have enough confidence in the policy. What determines the result is not the install. It is whether the deployment is scoped well, tuned continuously, and supported by people who can act on what the sensor finds.
Start with the traffic that matters most. On modern hosting infrastructure, that usually means public application traffic, administrative access paths, and any east-west flows that carry sensitive application or database activity. Sensor placement should follow risk, not convenience.
Then make an operating decision. A self-managed Snort deployment can work well if your team can maintain rules, review alerts, and keep noise under control week after week. If that work will sit in a backlog, managed support is usually the safer choice because an untuned IDS quickly turns into background noise.
Keep the first rollout narrow. Put Snort in front of one exposed service or one clearly defined segment, confirm that the alerts are actionable, and tune from there. That approach gives you a clean baseline and avoids spreading a weak configuration across the rest of your environment.
The goal is simple. Build a Snort deployment that your team will keep using.
If you are evaluating next steps, use the earlier infrastructure and operating model guidance to choose the right fit for your environment, then expand only after the first deployment is producing useful detections consistently.