

A service goes sideways in the worst possible way when users notice it before your team does. Support tickets start piling up. A checkout page hangs. Email delivery slows down. A VoIP queue sounds choppy. The infrastructure dashboard still shows green on the host, but the actual service your users rely on is already failing.
That gap is why SLA monitoring matters.
In a managed hosting environment, uptime alone doesn’t tell you enough. A virtual machine can be online while the application inside it is timing out. A Proxmox node can be healthy while one storage path is adding latency. A bare metal database server can stay reachable while query performance degrades enough to break an internal service target. If you’re responsible for production systems, you need a way to measure what customers experience, tie it to an agreed service level, and respond before a bad trend becomes a breach.
Effective SLA monitoring distinguishes good operations from noisy ones. Teams that do SLA monitoring well don’t just collect metrics. They define which metrics matter, map them to service objectives, and build alerts that support action instead of panic. In practice, that means monitoring the full path. Hypervisor, guest OS, application, storage, network, and ticket workflow all have to connect.
The examples throughout this guide use real managed hosting patterns: KVM VPS platforms, secure web hosting stacks, bare metal database servers, Proxmox private clouds, colocation, and managed service workflows. Where it makes sense, you’ll also see how this scales into production using options like VPS hosting, bare metal servers, Dedicated Proxmox private clouds, and fully managed IT services.
Introduction Why SLA Monitoring is Non-Negotiable
At 2:13 a.m., a client reports that checkout is timing out. The VPS is still online. The Proxmox cluster shows no node failure. CPU and memory look normal at first glance. The problem is storage latency on one path, and the application is already outside the response target the client cares about. Without SLA monitoring, that incident looks like a false alarm until revenue is already affected.
That is the practical reason teams at ARPHost treat SLA monitoring as an operating requirement, not a reporting task. In a managed hosting environment, partial failure is common. A server can answer ping while PHP workers are saturated. A bare metal database can stay reachable while disk wait pushes query time past the point users will tolerate. A backup job can keep failing unnoticed until the restore window matters.
Uptime is only one signal
Clients often ask for high uptime. In production, they need something more specific. They need a service that stays usable under normal load, degrades in a predictable way, and gets attention before a breach turns into a support escalation.
The right measurement depends on the platform and the service ARPHost is operating:
- On a KVM VPS: application response time, CPU steal, memory pressure, disk latency, and failed transactions usually matter more than host reachability.
- On a Proxmox private cloud: node health, storage replication status, backup success, quorum state, and VM recovery behavior define whether the platform is effectively meeting its target.
- On bare metal: RAID state, filesystem latency, hardware alerts, and service probes provide the evidence that matters.
- For managed IT operations: patch compliance, endpoint health, firewall status, ticket response timing, and escalation handling belong in the same service view.
A simple test helps here. If the monitor only proves that a machine has power and an IP address, it is not enough to support an SLA.
Clear monitoring changes incident handling
Incidents go badly when the provider and the client are measuring different things. One side is looking at node uptime. The other is looking at failed logins, slow admin actions, or missed voice calls. That gap creates avoidable argument during the incident and weak post-incident review after it.
A usable SLA monitoring model fixes that. It defines what “healthy” means for the service, records the signals that prove it, sets thresholds with enough buffer for intervention, and ties alerts to an owner who can act. At ARPHost, that usually means correlating infrastructure telemetry with service checks and operational workflow instead of treating them as separate systems.
Mixed environments make this harder and more important. A client might run public web workloads on a hosted stack, line-of-business apps on VPS instances, a database on bare metal, and internal systems on a dedicated Proxmox cluster. Those services fail in different ways. They also need different alert thresholds, response paths, and reporting periods.
For teams that want the provider to own both the monitoring and the response, managed service coverage is often the cleaner option. Monitoring has value when someone is responsible for the fix, not just the graph.
The Core Concepts SLIs SLOs and SLAs
A hosting team gets into trouble when it treats these three terms as interchangeable. They are related, but they serve different purposes in operations, reporting, and contracts.
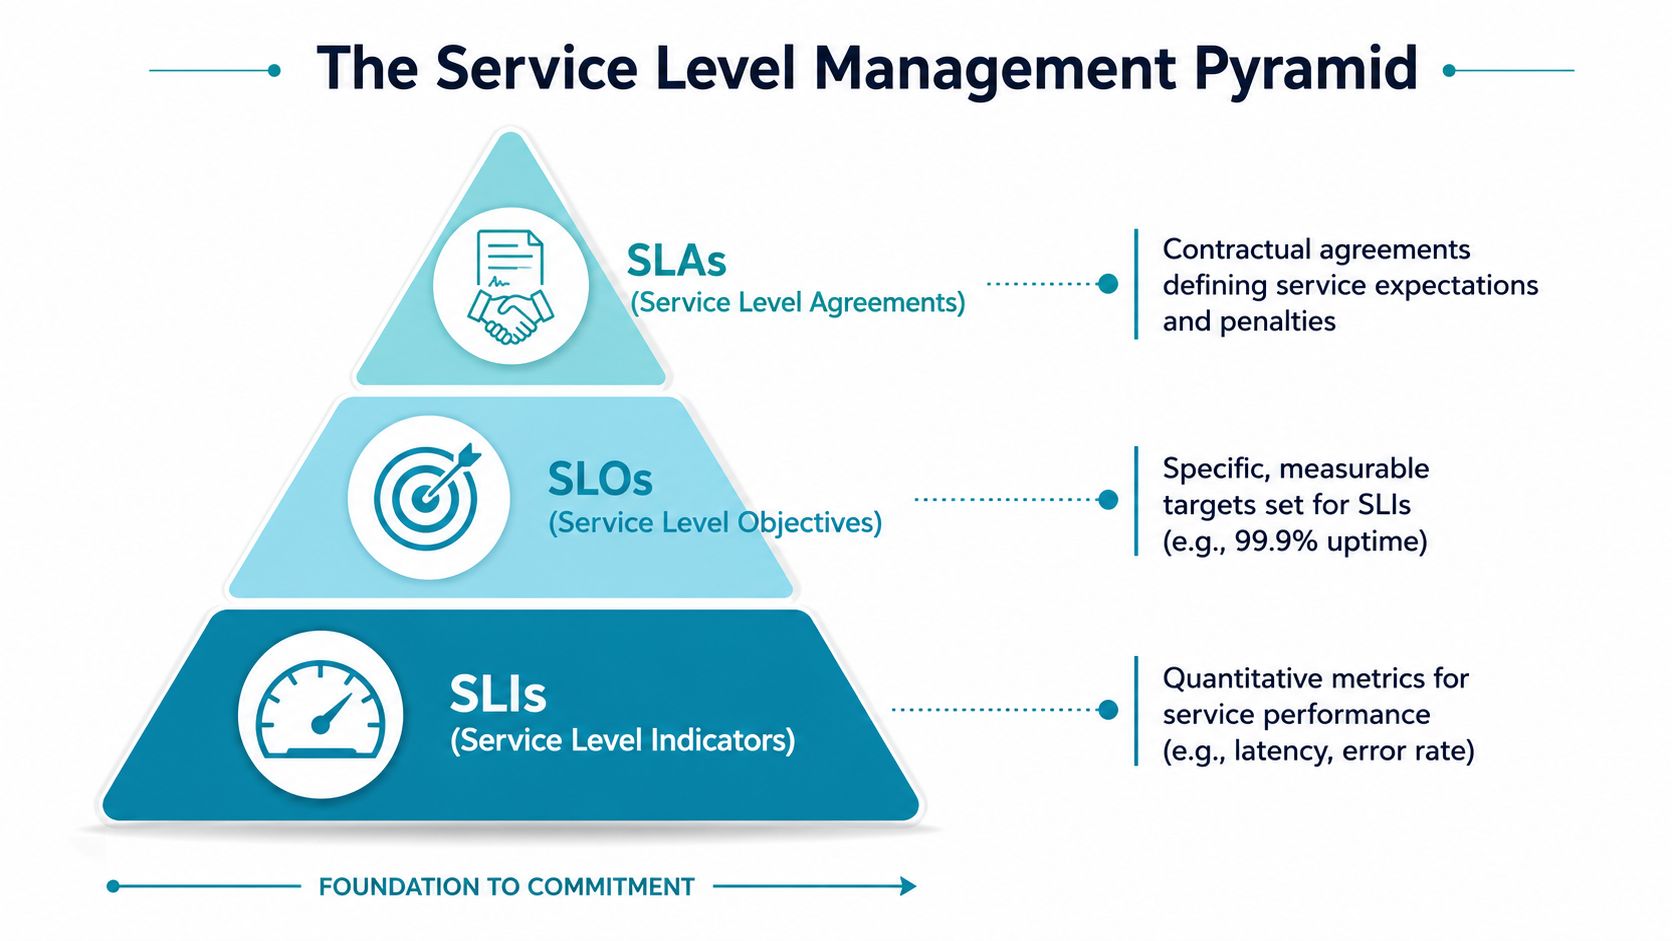
SLI measures actual service behavior
An SLI, or service level indicator, is a measurable signal tied to how a service performs. In a managed hosting environment, that can include application response time, failed transaction rate, storage latency, backup completion status, packet loss, ticket acknowledgment time, or successful synthetic login checks.
The key point is scope. A useful SLI reflects the service the client is buying, not just the health of one component underneath it.
At ARPHost, the right SLI depends on the platform. A Bare Metal database server may need disk latency, replication state, and backup success as primary indicators. A Proxmox cluster may need node health, quorum status, shared storage performance, and guest-level availability checks. A Managed IT service may need response time to critical tickets and time to start remediation, because support performance is part of the delivered service.
SLO sets the internal operating target
An SLO, or service level objective, is the target range for one or more SLIs. Operations teams use it to decide whether a service is running within acceptable limits before the client-facing commitment is at risk.
That buffer matters.
If an SLA promises a higher availability threshold for a hosted application, the internal SLO should be stricter. That gives ARPHost engineers time to investigate storage contention on a Proxmox node, migrate workload away from a stressed hypervisor, or replace failing hardware in a Bare Metal deployment before the issue becomes an SLA breach.
Useful SLOs share a few traits:
- They track user-visible outcomes, not only device status.
- They leave room for intervention before contract exposure starts.
- They map to the service boundary the client depends on.
- They reflect real operating conditions, including maintenance windows, failover behavior, and platform limits.
An unrealistic SLO creates noise. A weak one creates false confidence.
SLA defines the customer commitment
An SLA, or service level agreement, is the formal promise made to the client. It states what level of service ARPHost is committing to deliver and what happens if that commitment is missed.
Depending on the service, the SLA might cover:
- Availability for a hosted application or infrastructure platform
- Response time for managed incidents
- Restoration targets after a hardware or service failure
- Backup or recovery obligations
- Support coverage and escalation handling
This is the contract layer. Legal, operational, and technical teams all have to agree on what is being measured and how exceptions are handled.
How the three work together
The simplest way to separate them is by the question each one answers:
| Layer | What it answers | ARPHost example |
|---|---|---|
| SLI | What exactly are we measuring? | Synthetic HTTPS checks, VM resource contention, storage latency, backup job success |
| SLO | What internal target are we trying to hold? | Keep the hosted service inside a tighter internal availability and response threshold |
| SLA | What have we committed to the client? | Deliver the contracted service level and apply remedies if it is missed |
In practice, this hierarchy keeps monitoring honest. If a Proxmox host is up but guest applications are timing out, the infrastructure SLI may look fine while the service SLI shows a real problem. If the service SLI starts drifting but stays inside the SLA threshold, the SLO should still trigger action from the operations team.
That separation is what keeps a managed hosting provider from arguing over symptoms during an incident. It also makes post-incident review much cleaner, because the team can point to the measured indicator, the internal target, and the contract commitment without mixing them together.
SLA Monitoring Architecture and Key Metrics
SLA monitoring architecture has one job. It has to show whether ARPHost is meeting the service the client bought, and it has to show the operations team where a failure starts.
On a managed hosting platform, that means collecting evidence from more than one layer at the same time. A Proxmox node can look healthy while a storage pool is building latency. A guest VM can stay online while the application inside it is failing logins or timing out on writes. If the monitoring design only covers host uptime, the SLA report will look clean right up to the point where the client opens a ticket.
What the stack looks like in practice
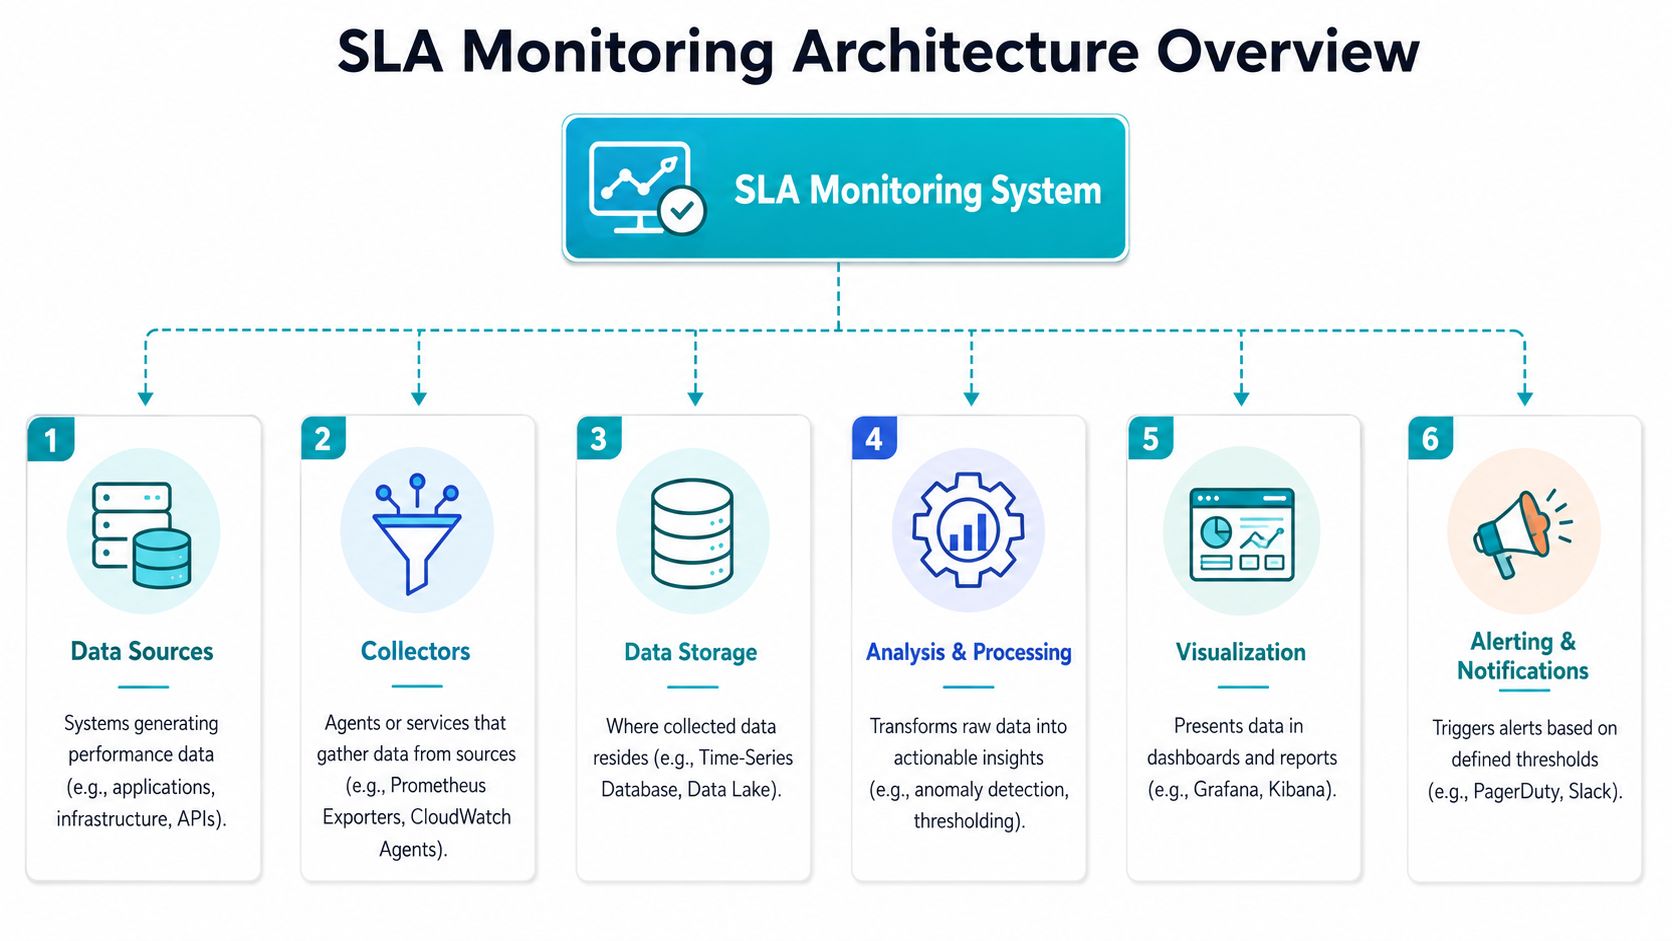
At ARPHost, a usable monitoring stack usually has six parts working together:
- Data sources: Proxmox nodes, guest VMs, bare metal systems, storage arrays, firewalls, control panels, backup jobs, and application endpoints
- Collectors: agents, exporters, API polling, syslog ingestion, and synthetic checks from outside the hosting environment
- Data storage: time-series metrics for performance history and log/event storage for incident correlation
- Analysis: threshold rules, trend analysis, service dependency checks, and alert conditions tied to service impact
- Visualization: separate dashboards for NOC staff, engineering teams, account managers, and client reporting
- Notification and escalation: ticket creation, paging, chat notifications, and escalation workflows into Managed IT support
The design choice that matters most is metric placement. Each metric needs to answer a service question, not just fill a graph.
A KVM guest can report CPU steal, memory pressure, and filesystem usage. A Proxmox cluster can report node state, quorum, replication health, and backup execution. External HTTPS probes can confirm whether the hosted application is reachable from the public internet. Firewall telemetry can confirm whether the issue is packet loss, blocked traffic, or a bad policy change.
That combination is what makes root cause analysis faster during an incident.
Match metrics to workload type
Different ARPHost services fail in different ways, so the key metrics have to change with the workload.
| Workload | Metrics that usually matter most | Infrastructure example |
|---|---|---|
| Secure web hosting | HTTP success checks, PHP worker saturation, disk usage growth, mail queue health, malware detection events | Webuzo, CloudLinux OS, Imunify360 |
| High-availability VPS | VM responsiveness, storage latency, CPU contention, memory pressure, application probe success | KVM VPS with clustered storage |
| Database server | Query latency, disk I/O wait, memory headroom, replication state, filesystem health | AMD EPYC 4584PX bare metal |
| Proxmox private cloud | Node availability, cluster quorum, backup success, storage replication status, guest health checks | Dedicated Proxmox cluster |
| VoIP and managed network services | Jitter, packet loss, registration status, firewall rule health, call path validation | Managed IT and network stack |
For a database-heavy application running on an ARPHost AMD EPYC 4584PX system, ping is rarely the metric that decides whether the service is healthy. Storage latency, memory pressure, and query response trends usually matter more. The server can stay online while the client-facing service is already degraded.
The same applies to virtualization. A Dual Intel Xeon E5-2690 V3 platform running Proxmox can host many stable workloads, but SLA monitoring has to watch hypervisor contention, backup status, and storage conditions alongside guest reachability. Shared infrastructure changes the failure pattern. The monitoring model has to reflect that.
Operational note: Infrastructure metrics explain why the service is degrading. Service checks confirm whether users are already affected.
Bare metal, VPS, and private cloud trade-offs
Platform choice changes the monitoring architecture.
In VPS environments, teams usually spend more effort separating guest-level issues from shared compute or storage pressure. On bare metal, attribution is cleaner. If latency rises on a dedicated database host, the investigation path is shorter because fewer tenants share the failure domain. In a Proxmox private cloud, the trade-off is flexibility. You get stronger isolation than a shared VPS layer, but the SLA model still has to cover node health, cluster behavior, and guest service checks together.
That is why ARPHost does not use one dashboard template for every service class. A managed WordPress deployment, a dedicated database server, and a Proxmox private cloud can all meet their SLA through different control points. The architecture has to reflect the service design, the hardware underneath it, and the operational path ARPHost uses to restore service when something starts drifting.
Implementing Your Monitoring and Alerting Strategy
A client opens a ticket at 2:07 a.m. Their site is still answering pings, but checkout requests are timing out and backups did not finish. Basic host monitoring says the server is up. The SLA is already drifting. That gap is where weak monitoring programs fail.
At ARPHost, the practical approach is to build alerting around the service promise, then map the infrastructure signals that explain risk and speed up recovery. A managed VPS running Webuzo needs different alert logic than a Bare Metal database host or a Proxmox cluster. One rule set across all three creates noise and hides ownership.
Build from the failure your client will notice
Start with checks that match the way the service is consumed. For a managed hosting client, that usually means testing login, page delivery, mail flow, SSL validity, backup success, and scheduled task execution. For a Proxmox environment, the first layer is different. VM power state, storage availability, node quorum, and console access matter before you even get to guest applications.
A rollout that holds up in production usually follows this order:
Define the transactions that matter to the client
On a managed web stack, use actions such as page load, admin login, form submission, outbound mail, and backup completion. On a private cloud, track VM reachability, datastore health, snapshot jobs, and cluster status.Pick a small number of indicators with clear owners
If ARPHost operations gets a storage latency alert, the storage or hypervisor team should own it. If a WordPress login check fails while the node stays healthy, that belongs on the application support path.Set warning and critical states by recovery window
Warning means there is still time to correct the issue before users feel it. Critical means service impact is already visible or likely within the current operating window.Attach the first response steps to the alert
The alert should identify scope, affected dependency, recent change window, and the first commands or console checks to run.Review alert noise on a schedule
If an alert pages the team and no one takes action, the threshold is wrong, the check is too shallow, or the service does not justify paging.
This keeps the monitoring model tied to support operations, not just to a pile of metrics.
Set thresholds from operating history
Thresholds work when they reflect how the platform behaves under normal load, backup windows, patch cycles, and failover events. Guesswork creates two bad outcomes. The first is constant false positives. The second is silent degradation that only shows up in client tickets.
On ARPHost Bare Metal systems, thresholding is often simpler because the failure domain is narrower. If disk latency rises on a dedicated database server, the investigation path is short. In a Proxmox cluster, the same symptom may come from shared storage pressure, a noisy VM, backup activity, or node imbalance. The threshold still matters, but the alert has to include enough context to shorten triage.
Good thresholds usually have four traits:
They use sustained behavior, not one short spike
A brief jump in CPU may not matter. Ten minutes of rising I/O wait during a backup window usually does.They follow service priority
A failed customer-facing transaction deserves more weight than an isolated host metric with no user impact.They differ by service tier
A development VPS should not wake the same on-call path as a production private cloud or a revenue-generating e-commerce stack.They define recovery
Teams need clear conditions for closing the incident, not just opening it.
Here’s a simple Linux check that can feed a custom alert for disk pressure on a managed server:
#!/bin/bash
usage=$(df / | awk 'NR==2 {print $5}' | tr -d '%')
if [ "$usage" -ge 85 ]; then
  echo "WARNING: root filesystem usage is high"
fi
That check becomes useful when it is tied to service risk. On an ARPHost-managed web server, root filesystem pressure can break logs, mail queues, backups, and application writes long before the host is technically down.
A second example from a Proxmox host helps expose guest impact:
pvesh get /nodes/$(hostname)/status
pvesh get /cluster/status
Those commands help during triage. They do not prove the service is healthy. ARPHost pairs hypervisor checks with guest and application tests so the team can tell the difference between a node problem, a cluster problem, and a single workload issue.
Field advice: Page on conditions that require a response. Record the rest for trend analysis.
Build dashboards for decisions, not display
Dashboards fail when they try to show everything. Good dashboards answer the next operational question fast.
| Question | What the dashboard should show |
|---|---|
| Is the service healthy right now | Current application checks, host or cluster state, active incidents, and recent failed jobs |
| Is the service degrading | Short-term trends for latency, errors, queue growth, storage behavior, and resource pressure |
| Who acts next | Escalation owner, current severity, linked runbook, and whether ARPHost operations or application support has the handoff |
For managed hosting, three dashboard views usually work best:
- Operations view: Node health, VM state, storage performance, network alerts, backup jobs, and patch status
- Service view: Client-facing transactions, SLA status, open incidents, and recovery progress
- Management view: Incident count, affected services, repeat failure patterns, and monthly performance summary
The split matters. Engineers need detail. Account and service managers need service posture and resolution status.
Put escalation paths in the design
Monitoring without escalation discipline is only reporting. In practice, ARPHost maps alerts to the team that can act fastest. Hardware faults go one way. Hypervisor contention goes another. Application failures on managed stacks follow their own path. That separation cuts time lost during handoff and keeps SLA breaches from growing while teams debate ownership.
The strongest alerting strategies also account for maintenance, backup windows, and planned changes. A midnight kernel patch on a managed VPS should not look like an unexplained outage. A storage rebalance in a Proxmox cluster should have temporary threshold adjustments and a known rollback path. Otherwise, change activity floods the queue and trains engineers to ignore the system.
ARPHost is a good fit for teams that want the monitoring, escalation, and remediation process handled as part of the service. The practical value is not just tool coverage. It is the operating model behind it: proactive checks, patch coordination, security oversight, backup monitoring, and support teams that already understand the difference between a Bare Metal fault, a VPS-level issue, and a Proxmox cluster condition.
Real-World SLA Examples for Hosting Services
At 2:13 a.m., a client database starts timing out during a backup window. The first question is never “what does the SLA say?” The first question is “which layer failed, and who owns the fix?” Good SLA monitoring answers both fast.
That is why hosting SLAs need to map cleanly to the platform they cover. At ARPHost, a shared web hosting service, a managed VPS, a single-tenant bare metal server, and a Proxmox private cloud do not carry the same operational risk. They should not carry the same service promise either.
What a strong hosting SLA usually includes
A useful hosting SLA defines the service boundary, how availability is measured, what counts as an incident, how maintenance is handled, and what happens if the provider misses the target. If the environment is managed, it also needs to mark the handoff between infrastructure support and application support.
The practical test is simple. Operations should be able to defend every SLA commitment with monitoring data, ticket history, and a clear ownership trail.
A solid clause set usually covers:
- Availability scope: Which service components are included, and which checks determine health
- Incident classification: What separates critical impact from degraded service or minor faults
- Support handling: Response expectations and escalation rules for managed services
- Hardware responsibility: Replacement workflow for failed disks, memory, controllers, or full host faults
- Reporting: How clients review monthly performance, incidents, and any SLA credits or remediation steps
Sample ARPHost SLA Targets by Service Tier
The table below shows how targets often differ across hosting models. The important point is not the wording. The important point is that stronger commitments usually follow deeper provider ownership of the stack.
| Service Metric | Secure Web Hosting | High-Availability VPS | Managed Bare Metal Server | Managed Proxmox Private Cloud |
|---|---|---|---|---|
| Availability scope | Web, mail, and control panel service availability within the hosting platform | VM availability plus platform storage and virtualization health | Server availability, hardware health, and managed OS-level service checks | Cluster, node, storage, and managed guest service health |
| Primary indicators | HTTP checks, mail flow, panel access, security event state | VM reachability, storage responsiveness, app probes | Hardware status, OS service checks, storage and application health | Cluster quorum, node state, guest health, backup and storage status |
| Response model | Best-effort hosting support with platform-level issue triage | Infrastructure response with escalation for virtualization and storage issues | Managed response for host and service incidents | Coordinated response across cluster, storage, and guest layers |
| Hardware commitment | Shared platform, no tenant-specific hardware clause | Platform-managed infrastructure replacement workflow | Explicit managed hardware replacement handling | Dedicated node remediation and cluster-aware failover handling |
| Backup monitoring | Scheduled hosting backup job visibility where included | VM backup status and restore workflow based on plan | Server backup verification where managed | Cluster-aware backup monitoring and restoration planning |
| Best fit | Websites, email, smaller business applications | Production apps needing flexible scaling and stronger isolation | Databases, game servers, media workloads, single-tenant services | Business-critical virtualization, internal clouds, migration targets |
Matching the SLA to the platform
Platform choice shapes what can be monitored and what can be promised.
A memory-heavy database on a dedicated AMD EPYC system usually gets a cleaner SLA than the same workload on a shared virtualization layer. There is less contention, fewer abstraction layers, and simpler fault isolation. If latency rises, ARPHost can inspect the host, storage path, and managed OS checks without also proving whether another tenant caused pressure on the node.
A managed VPS changes that trade-off. Provisioning is faster, resizing is easier, and platform-level resilience can be strong, but the SLA has to account for hypervisor health, shared storage behavior, and VM-level observability. Monitoring still works well, but the signal path is broader.
Proxmox private clouds add another level of responsibility. They support better fault-domain design, planned failover, and more flexible workload placement. They also require SLA monitoring at the cluster layer, not just inside the guest. Quorum state, node health, replication lag, backup success, and storage performance all affect whether the service objective is being met.
Practical examples from managed hosting
A managed bare metal server often suits workloads where isolation matters more than elasticity. Typical examples include transactional databases, media processing jobs, licensed software with strict host binding, and single-tenant application stacks. In those cases, ARPHost can tie the SLA directly to hardware health, managed operating system checks, service reachability, and replacement handling for failed components.
A high-availability VPS is a better fit for application teams that need faster rollout, simpler scaling, and strong but shared infrastructure controls. The SLA focus usually shifts toward VM uptime, storage responsiveness, backup visibility, and response to virtualization faults.
A managed Proxmox environment fits teams running several business services that need separation, migration options, and planned resilience across nodes. Here, the SLA is broader by design. It has to cover cluster health, storage behavior, guest availability, and the process for recovering from a node or storage event without turning a localized failure into a platform-wide outage.
Choosing the right commitment
The wrong SLA usually starts with the wrong platform decision.
If a client wants strict performance isolation and direct accountability for host-level faults, single-tenant infrastructure is often the better fit. If the priority is deployment speed and flexible resource changes, a managed VPS may be the better operational choice. If the goal is to run multiple workloads with controlled failover and centralized virtualization management, a Proxmox private cloud usually justifies the added monitoring depth.
ARPHost handles all three models differently because the failure modes are different. That is the practical lesson behind SLA monitoring. Good agreements are built around real systems, real ownership boundaries, and real recovery workflows.
Integrating SLA Monitoring into Your Business Workflow
A storage controller starts reporting errors on a client database server at 02:13. The monitoring platform catches it, but if that alert stays in a dashboard instead of becoming an owned incident, the SLA record is already weak. The drive might get replaced by morning and the service might stay online, yet ARPHost still needs proof of who responded, how quickly the case was triaged, what client communication went out, and whether the same pattern exists on similar hardware.
That is the difference between monitoring a metric and operating a service.
At ARPHost, SLA monitoring has to connect directly to the work itself. On Bare Metal, that means hardware telemetry, RAID state, SMART data, network reachability, and backup status must tie into ticketing and escalation. In a managed Proxmox cluster, the signal set is broader. Node health, storage latency, VM availability, replication jobs, and migration events all need clear ownership and a defined response path. Managed IT adds another layer because OS issues, patch side effects, security controls, and application failures can all affect whether the actual service commitment was met.
From signal to service action
The useful unit is the service action, not the alert itself. A failed synthetic check, a Proxmox node alarm, a degraded RAID array, or a firewall policy failure should all enter the same operating model with different routing and urgency.
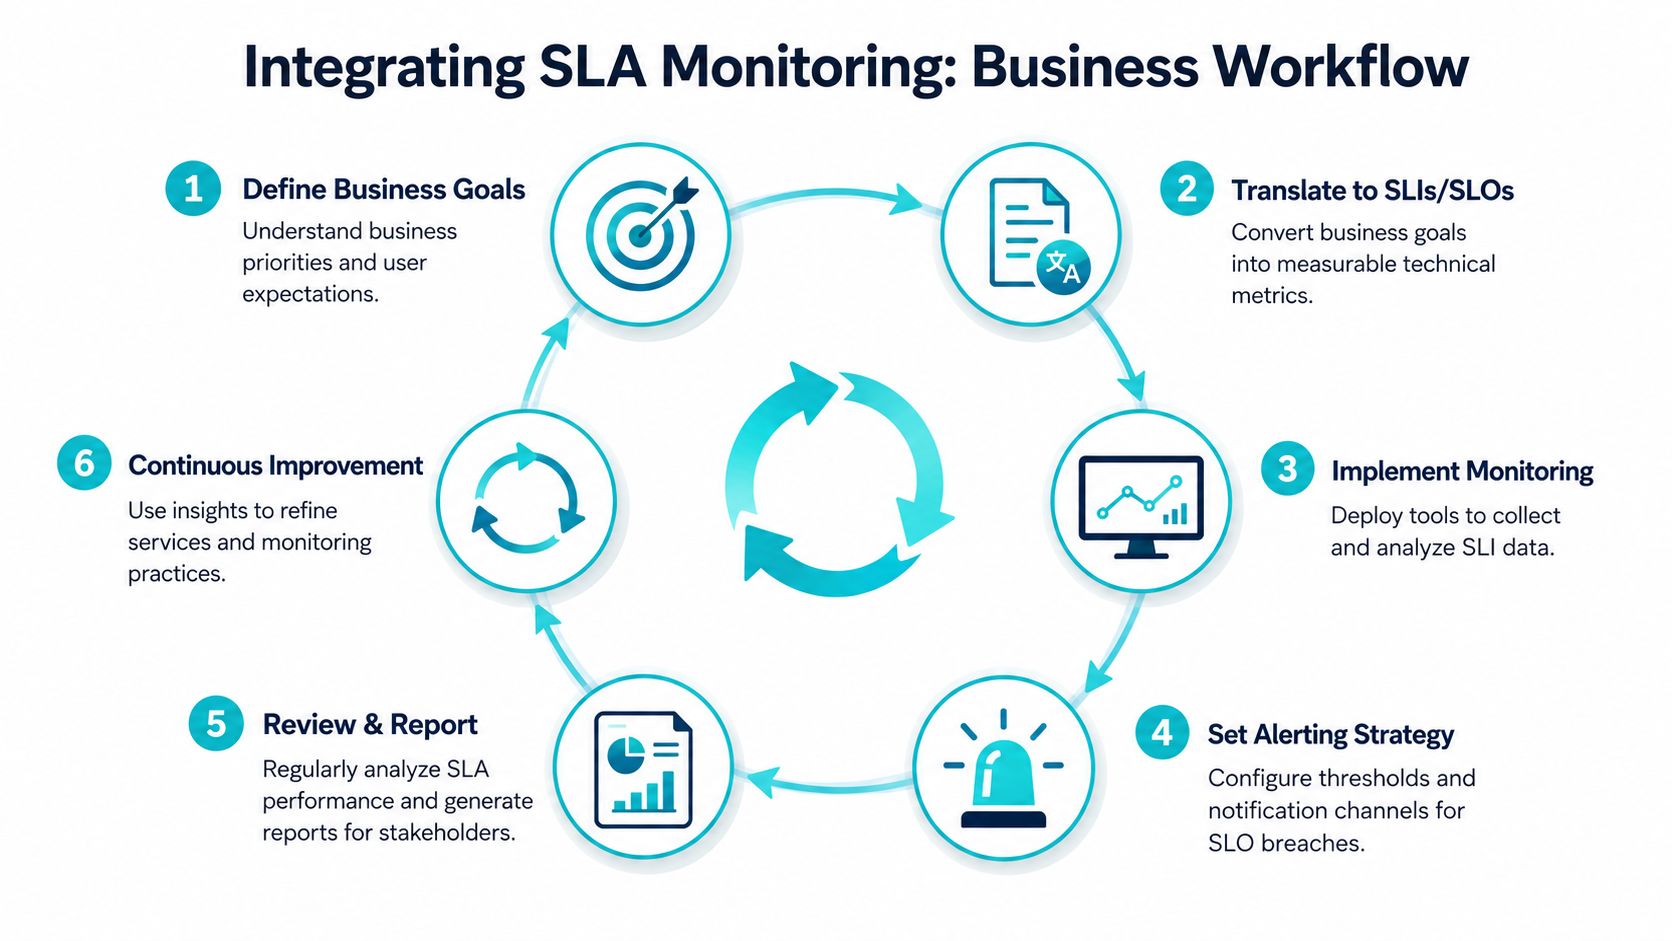
A practical workflow usually includes six steps:
Detection
Monitoring identifies degraded service through application checks, host telemetry, virtualization events, backup failures, or security tooling.Classification
The event is mapped to the client, platform, affected asset, severity, support scope, and ownership boundary.Record creation
An incident or ticket opens automatically so response time, actions taken, and service impact are captured from the start.Queue assignment
Platform issues go to virtualization engineering. OS and service failures go to systems staff. Network and firewall faults route to the network team.Context delivery
The responder needs host history, recent changes, linked assets, and the standard recovery procedure attached to the case.Review and reporting
Closed incidents feed monthly reporting, threshold tuning, runbook updates, and pattern review across the fleet.
Many providers often fall short here. Detection exists. Evidence does not.
Where automation helps, and where it hurts
Automation earns its place when it removes delay without hiding the actual fault. ARPHost uses it selectively for that reason.
A low-risk process failure on a managed VM can justify an automatic restart followed by verification and ticket logging. A storage fault on a Bare Metal server should trigger immediate human ownership, escalation, and hardware review. Automatic action in that case can waste time or mask a larger hardware issue. The same trade-off applies in Proxmox environments. Restarting a guest may restore one VM, but it does not solve a node-level resource problem, shared storage instability, or a replication failure that can affect multiple tenants.
Useful integrations usually cover:
- Automatic incident creation for priority checks that cross defined thresholds
- Asset mapping so the correct VM, host, node, or firewall is attached immediately
- Change correlation to show whether maintenance or configuration work occurred near the event window
- Runbook attachment so first-response steps are consistent across engineers and shifts
- Client update hooks so communication follows the actual incident timeline
Teams that rely on inboxes, chat threads, and memory lose continuity fast once incidents overlap.
Visibility has to match the audience
Raw infrastructure alerts are useful for engineers and noisy for everyone else. Client-facing reporting should show service state, impact, current action, and next update point. Internal operations teams need the technical detail behind that summary. Management needs trend data, repeat offenders, and open operational risk.
The same event can produce three valid views.
In ARPHost environments, this matters because one client may run public applications on managed virtual infrastructure, keep databases on single-tenant hardware for performance isolation, and place internal services on a Proxmox cluster. The monitoring stack can be shared, but the reporting should still reflect who is reading it and what decisions they need to make.
| Audience | What they need |
|---|---|
| Operations engineers | Technical metrics, dependency status, logs, and active remediation steps |
| IT managers | Current service state, unresolved incidents, recurring faults, and operational risk |
| Business stakeholders | Service impact summaries, accountability trends, and issue patterns affecting the business |
| Clients | Clear health status, incident updates, and confirmation that support actions match the agreed service model |
Why ownership decides whether SLA monitoring works
SLA monitoring only matters if the path from detection to resolution is assigned clearly. In a managed hosting model, that can include monitoring, escalation, patch coordination, backup verification, security controls, and incident communication under one provider. Without that ownership model, alerts often stop at a handoff point and the client ends up coordinating the outage.
Some teams want ARPHost to own the full stack. Others keep application ownership in-house and want us accountable only for infrastructure, virtualization, network, and managed operating system scope. Both models can work. The difference is whether the boundary is defined early and reflected in the monitoring workflow, response queues, reporting, and evidence trail.
Good SLA monitoring changes response behavior, shortens escalation paths, and leaves a record that holds up during service reviews and incident follow-up. If the system cannot show what happened on the server, in the cluster, across the support workflow, and in client communication, it is not ready to support a serious hosting SLA.