


In today's fast-paced digital landscape, server downtime is not just an inconvenience; it's a direct threat to revenue, reputation, and customer trust. Proactive monitoring has shifted from a best practice to an essential business function for any modern infrastructure. Whether you're managing bare metal servers, a high-availability Proxmox private cloud, or a fleet of VPS instances, the right server performance monitoring tools provide the critical visibility needed to identify bottlenecks, prevent outages, and optimize resource utilization before issues impact end-users. The complexity of modern applications further amplifies this need. For instance, managing the intricate connections within an architecture built on highly scalable APIs for microservices necessitates advanced monitoring capabilities to ensure smooth operation and identify bottlenecks proactively.
This guide cuts through the noise, offering a technical deep-dive into 12 leading monitoring platforms. We move beyond marketing copy to provide an honest assessment of each tool's core strengths, practical limitations, and ideal deployment scenarios. You will find detailed analysis, screenshots, and direct links to help you evaluate which solution best fits your operational needs, from startups managing a single secure web hosting bundle to enterprises running complex, multi-cloud environments. We'll analyze their core strengths, ideal use cases, and how they integrate into environments like those managed by ARPHost, where performance and reliability are paramount. From open-source powerhouses like Prometheus and Zabbix to sophisticated SaaS platforms like Datadog and Dynatrace, this resource will equip you to make an informed decision that aligns with your technical requirements and business objectives.
1. Datadog
Datadog is a comprehensive, cloud-native observability platform that excels at unifying metrics, traces, and logs from your entire stack. It's one of the top-tier server performance monitoring tools for organizations that need a single pane of glass across hybrid environments, including on-premise servers like those managed by ARPHost, multi-cloud deployments, and containerized applications. Its agent-based data collection is straightforward to deploy, offering a rapid time-to-value.
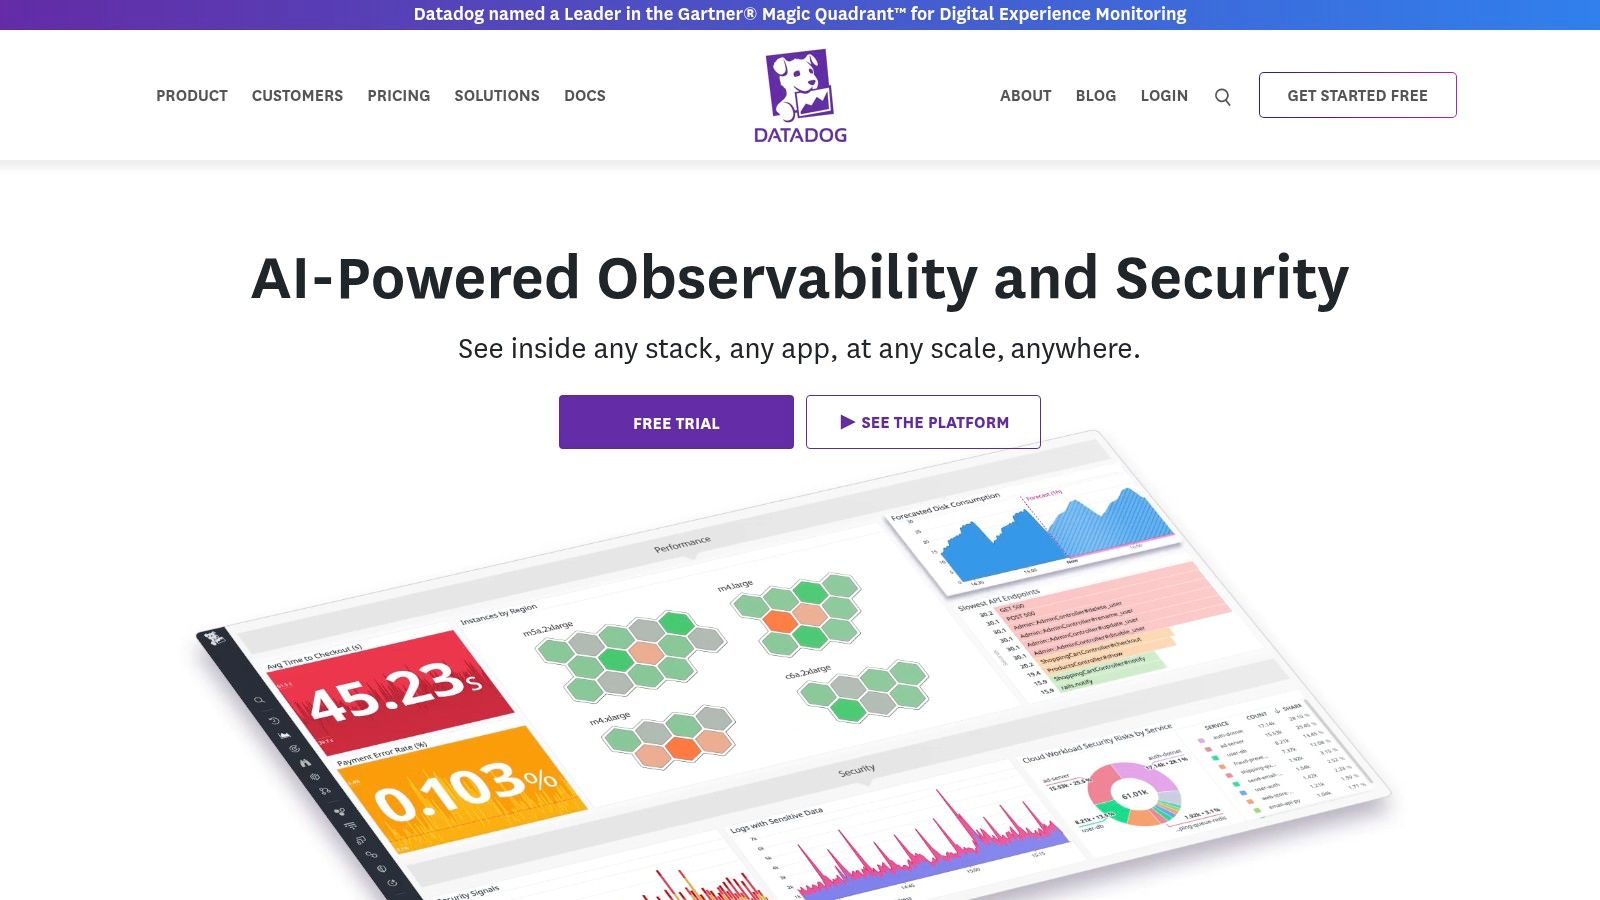
The platform’s strength lies in its extensive library of over 850 integrations, allowing you to pull data from virtually any service or system, from NGINX on a bare metal server to a Kubernetes cluster running in a private cloud. The pre-configured dashboards provide immediate insights, while the customizable dashboard builder allows DevOps teams to create specific views tailored to their services. Datadog's anomaly detection and forecasting features use machine learning to proactively identify issues before they impact users.
How to Implement Datadog on an ARPHost Server (Example)
Deploying the Datadog agent on a Linux-based server, such as one of ARPHost’s VPS hosting plans, is a simple, command-line driven process.
Sign up for Datadog and retrieve your API key from the Integrations > APIs section.
SSH into your server and run the one-step installation command, substituting
YOUR_API_KEYwith your actual key:DD_API_KEY=YOUR_API_KEY DD_SITE="datadoghq.com" bash -c "$(curl -L https://s3.amazonaws.com/dd-agent/install_script.sh)"Within minutes, your server will appear in the Datadog Infrastructure List, automatically reporting CPU, memory, network, and disk metrics. This aligns with infrastructure monitoring best practices by providing immediate, objective oversight.
Key Features:
- Infrastructure Monitoring: Real-time host and container metrics with auto-discovery.
- APM & Distributed Tracing: Pinpoint application performance bottlenecks.
- Log Management: Ingest, search, and analyze logs without indexing limits.
- Synthetic Monitoring: Proactively test user journeys from global locations.
Pros:
- Vast integration ecosystem simplifies data collection.
- Powerful, intuitive UI and data visualization tools.
- Unified platform reduces tool sprawl.
Cons:
- Pricing can become expensive at scale, especially with multiple add-on modules.
- The sheer number of features can present a steep learning curve.
Website: https://www.datadoghq.com/
2. New Relic
New Relic is a full-stack observability platform that provides a unified view of your entire technology stack, from server infrastructure to application performance and end-user experience. It stands out as one of the most accessible server performance monitoring tools due to its transparent, usage-based pricing and a generous free tier, making it a viable option for both startups and large enterprises. Its core strength is unifying metrics, events, logs, and traces (MELT) into a single, queryable data platform.
The platform’s powerful New Relic Query Language (NRQL) allows engineering teams to perform ad-hoc analysis and create custom dashboards to visualize any dataset. This flexibility is crucial for deep-diving into performance anomalies, whether they originate from a bare metal server or a containerized application. By combining infrastructure monitoring with Application Performance Monitoring (APM) and Real User Monitoring (RUM), New Relic provides a comprehensive understanding of how server health directly impacts application responsiveness and business outcomes.
How to Implement New Relic on an ARPHost Server (Example)
For a business running workloads on an ARPHost bare metal server, deploying the New Relic agent provides immediate visibility into CPU, memory, and network usage. This data is essential when you need to optimize website performance by correlating backend server metrics with frontend load times.
Create a New Relic account and get your license key and account ID.
Use the guided install CLI tool on your server for the simplest setup:
curl -Ls https://download.newrelic.com/install/newrelic-cli/scripts/install.sh | bash && sudo NEW_RELIC_API_KEY=YOUR_API_KEY NEW_RELIC_ACCOUNT_ID=YOUR_ACCOUNT_ID /usr/local/bin/newrelic installThe installer automatically detects your OS and running applications (like Apache or MySQL), installing the relevant integrations and shipping telemetry data to the platform instantly.
Key Features:
- Unified Telemetry: A single platform for all metrics, events, logs, and traces.
- NRQL (New Relic Query Language): Powerful SQL-like language for ad-hoc data analysis.
- Full-Stack Observability: Includes APM, infrastructure, logs, synthetics, and RUM.
- Applied Intelligence: AIOps capabilities for anomaly detection and root cause analysis.
Pros:
- Generous free tier with 100 GB of data ingest per month.
- Transparent and predictable usage-based pricing model.
- Broad feature coverage suitable for SMBs and enterprise teams.
Cons:
- Budgeting requires careful monitoring of data ingestion and user seat consumption.
- Some advanced features and extended data retention require higher-tier plans.
Website: https://newrelic.com/
3. Dynatrace
Dynatrace is an observability platform powered by its AI engine, Davis, designed for automatic and intelligent monitoring. It stands out among server performance monitoring tools by focusing on causation rather than just correlation, automatically mapping dependencies across your entire stack. This AI-driven approach provides deep, actionable answers for complex, dynamic environments, from on-premise servers to multi-cloud and containerized applications.
The platform's strength is its automation. The OneAgent technology automatically discovers all components of your technology stack, from hosts and processes to services and their interdependencies, creating a real-time topology map called Smartscape. This context allows Davis to perform automatic root-cause analysis, pinpointing the precise source of performance degradation or failures without manual configuration. This capability is especially powerful for identifying issues that span multiple services, such as a slowdown in an application caused by an underlying database issue.
How to Implement Dynatrace on an ARPHost Server (Example)
Dynatrace is best suited for enterprise-level organizations with complex, distributed systems. For a business running critical applications on an ARPHost bare metal server, Dynatrace can provide code-level visibility into application performance and its direct relationship to server resources.
In your Dynatrace environment, navigate to Deploy Dynatrace and select Start installation.
Choose Linux as the operating system.
Generate a PaaS token and copy the provided download and installation script. It will look similar to this:
wget -O Dynatrace-OneAgent.sh "https://YOUR_ENVIRONMENT_ID.live.dynatrace.com/api/v1/deployment/installer/agent/unix/default/latest?arch=x86-64&flavor=default" --header="Authorization: Api-Token YOUR_PAAS_TOKEN"
/bin/bash Dynatrace-OneAgent.sh
Once executed, the OneAgent automatically instruments the host and running processes, aligning with best practices for database performance optimization by correlating database calls with application traces and server metrics.
Key Features:
- Full-Stack Monitoring: Automatic discovery and observability for infrastructure, applications, and user experience.
- Davis AI: Causation-based AI engine for automatic root-cause analysis.
- PurePath Technology: Distributed tracing for code-level visibility across transactions.
- Digital Experience Monitoring: Real user and synthetic monitoring for web and mobile apps.
Pros:
- Exceptional automation simplifies deployment and analysis.
- Powerful AI-driven root-cause detection saves significant troubleshooting time.
- Predictable, consumption-based pricing models.
Cons:
- Can be an overly complex solution for smaller teams or simple environments.
- Pricing, while predictable, is geared toward enterprise budgets and requires planning.
Website: https://www.dynatrace.com/
4. Grafana Cloud
Grafana Cloud offers the renowned Grafana visualization experience as a fully managed, scalable platform. It's an excellent choice for teams that love Grafana's powerful dashboarding capabilities but want to offload the backend management of metrics (Prometheus), logs (Loki), and traces (Tempo). As one of the most flexible server performance monitoring tools, it provides a composable observability stack that integrates seamlessly into diverse environments.
The platform stands out by bundling a cohesive, open-source-based monitoring solution without vendor lock-in. Turnkey integrations for Linux, Windows, and Kubernetes simplify data collection, while pre-built dashboards offer immediate insights into system health. Its support for OpenTelemetry makes it a future-proof choice for modern application monitoring, and optional add-ons like k6 for load testing and Synthetic Monitoring complete the observability picture.
How to Implement Grafana Cloud on an ARPHost Server (Example)
For a company running workloads on ARPHost's bare metal servers or a Dedicated Proxmox Private Cloud, Grafana's agent can be deployed to ship host metrics and logs to the cloud platform.
- In your Grafana Cloud portal, navigate to Connections > Add new connection.
- Select the Linux Server integration and follow the on-screen instructions. You will be provided with a script to run on your server.
- The script automatically installs the Grafana Agent and configures it to scrape node metrics (via the
node_exporter) and system logs (viapromtail). A pre-built dashboard for Linux hosts will be automatically installed in your Grafana instance.
This provides a clear, centralized view of infrastructure performance, helping teams correlate server-level issues with application behavior quickly and efficiently.
Key Features:
- Managed Observability Stack: Fully managed and scalable Prometheus, Loki, and Tempo.
- Turnkey Integrations: Pre-configured agents and dashboards for common systems like Linux, Windows, and Kubernetes.
- Unified Visualization: The familiar, powerful Grafana interface for all your metrics, logs, and traces.
- OpenTelemetry Support: Natively ingest OpenTelemetry data for modern, vendor-neutral instrumentation.
Pros:
- Leverages the widely adopted and familiar Grafana UI.
- A generous free tier makes it accessible for small projects and teams.
- Managed backend removes the operational burden of scaling and storage.
Cons:
- Usage and data retention limits on lower-priced tiers can be restrictive.
- The per-product pricing model requires careful planning to control costs.
Website: https://grafana.com/
5. Prometheus
Prometheus is the de facto open-source standard for metrics-based monitoring and alerting, originating from the cloud-native ecosystem. It operates on a pull-based model, scraping time-series data from configured endpoints, making it one of the most powerful server performance monitoring tools for teams that demand full control over their observability stack. Its design is ideal for dynamic environments like container orchestration and microservices.
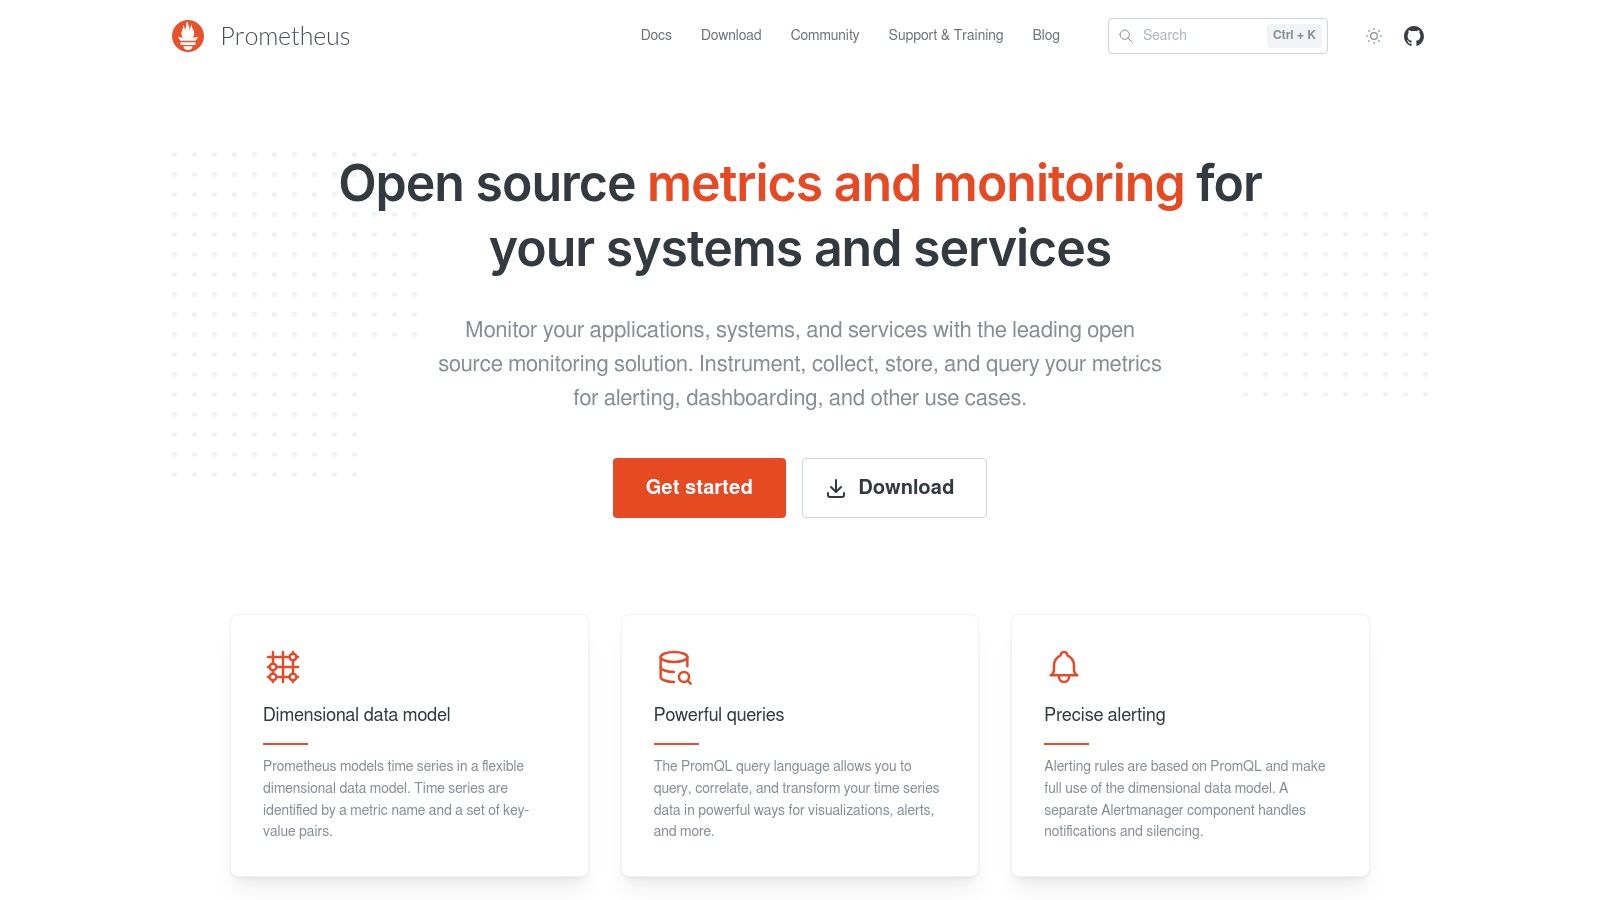
The platform's power comes from its simple yet robust data model and the PromQL query language, which allows for sophisticated analysis and aggregation of metrics. With a vast ecosystem of "exporters," Prometheus can collect metrics from hundreds of third-party systems, including Linux servers, databases, and web servers. This flexibility allows engineering teams to build a highly customized monitoring solution tailored to their specific needs without vendor lock-in.
How to Implement Prometheus on an ARPHost Server (Example)
Prometheus is best suited for engineering and DevOps teams with the technical expertise to build and manage their own monitoring infrastructure. For a business running a Kubernetes cluster on ARPHost's bare metal servers, Prometheus offers native service discovery and deep insights. Here’s a basic setup for monitoring the host itself:
- Install
node_exporteron the host to expose hardware and OS metrics.wget https://github.com/prometheus/node_exporter/releases/download/v1.7.0/node_exporter-1.7.0.linux-amd64.tar.gz tar xvfz node_exporter-1.7.0.linux-amd64.tar.gz ./node_exporter-1.7.0.linux-amd64/node_exporter & - Install and configure Prometheus on a separate management server or VM. Edit
prometheus.yml:scrape_configs: - job_name: 'node' static_configs: - targets: ['YOUR_SERVER_IP:9100'] - Start Prometheus, and it will begin scraping metrics from your bare metal server. While powerful, managing storage and high availability requires significant effort, which is where ARPHost's fully managed IT services can complement a self-hosted strategy by handling the underlying infrastructure.
Key Features:
- Multi-dimensional Data Model: Time series are identified by a metric name and key-value pairs.
- Powerful Queries with PromQL: A flexible query language to slice and dice time-series data.
- Pull-Based Metrics Collection: Simplifies service discovery and instrumentation over HTTP.
- Alertmanager: Handles alerting, including silencing, inhibition, and routing to various receivers.
Pros:
- Completely free and open-source with a massive community.
- The standard for Kubernetes monitoring and CNCF-graduated project.
- Highly reliable and efficient single-server architecture.
Cons:
- Requires significant in-house expertise to scale and maintain.
- Lacks a built-in, long-term storage solution out of the box.
- Does not natively handle logs or traces, requiring other tools.
Website: https://prometheus.io/
6. Zabbix
Zabbix is a mature, enterprise-grade open-source monitoring solution that provides immense flexibility for organizations that prefer self-hosting their monitoring stack. As one of the most powerful free server performance monitoring tools, it delivers a comprehensive feature set for tracking servers, networks, applications, and cloud services without any licensing fees. Its robust data collection methods include agents for major operating systems and agentless monitoring via SNMP, IPMI, and other protocols.
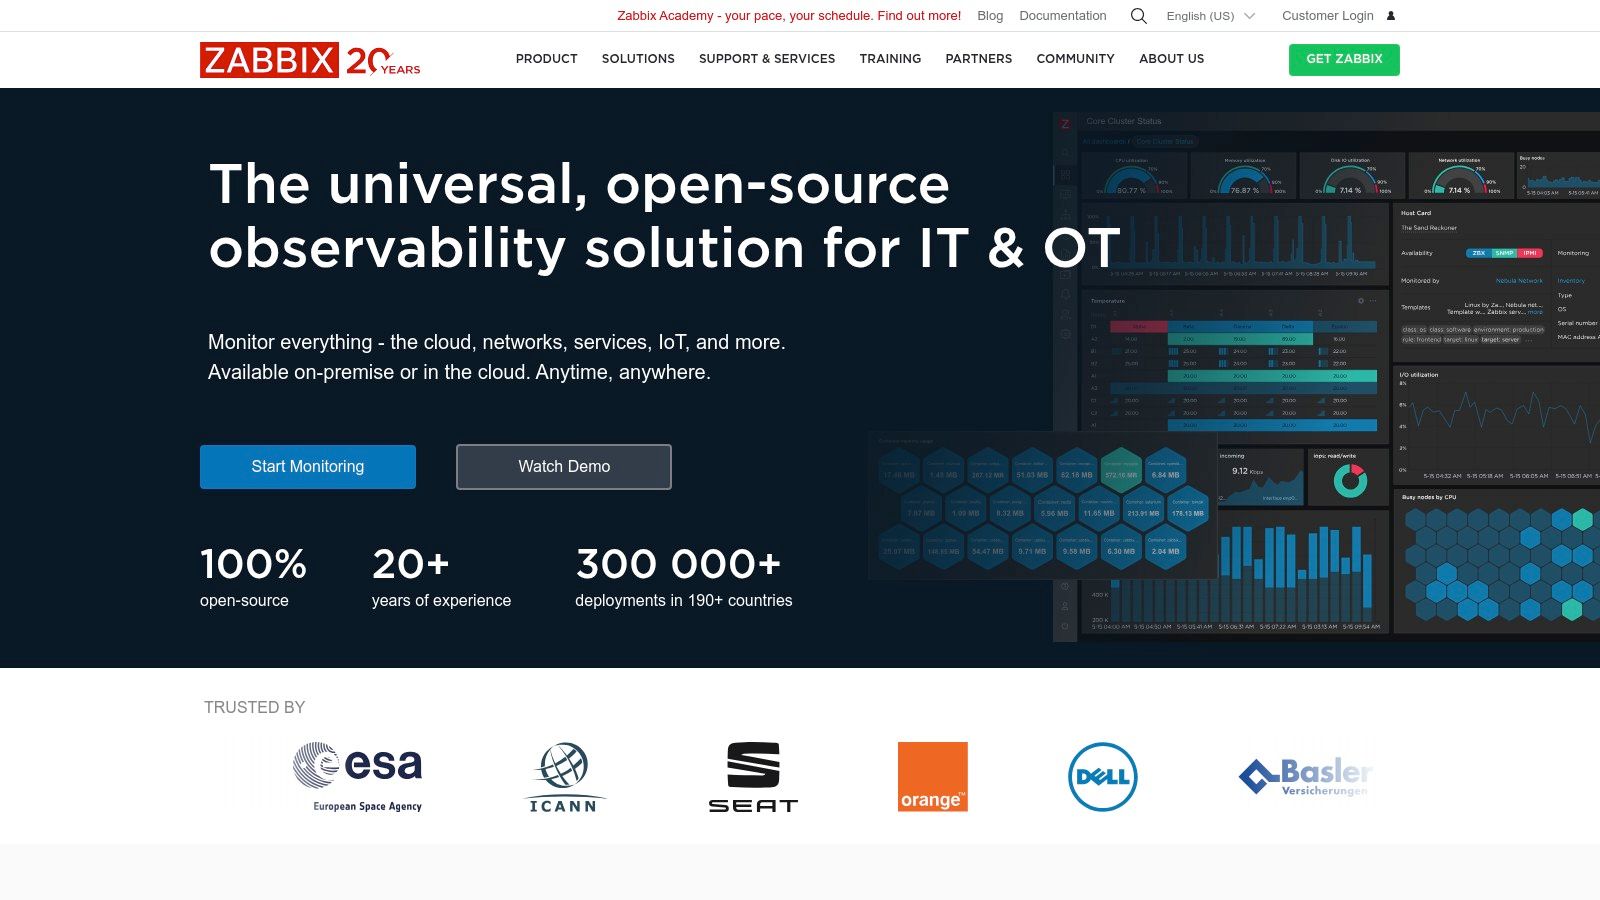
The platform stands out with its powerful templating and auto-discovery capabilities, which automate the process of adding and configuring new hosts. This makes it highly scalable for large, dynamic environments. Zabbix provides extensive visualization options, including graphs, network maps, and customizable dashboards, allowing teams to build detailed operational views. Its alerting and remediation system is highly configurable, enabling automated responses to detected issues.
How to Implement Zabbix on an ARPHost Server (Example)
Zabbix is an excellent choice for businesses with the technical expertise to manage their own monitoring infrastructure. For an organization running a bare metal server fleet or a Dedicated Proxmox Private Cloud from ARPHost, Zabbix can be deployed on a separate VM.
- Install the Zabbix Server on a dedicated VM within your Proxmox environment, following the official documentation for your chosen OS (e.g., Debian).
- Install the Zabbix Agent on each bare metal node or guest VM you wish to monitor.
# On a Debian/Ubuntu host wget https://repo.zabbix.com/zabbix/6.4/debian/pool/main/z/zabbix-release/zabbix-release_6.4-1+debian11_all.deb dpkg -i zabbix-release_6.4-1+debian11_all.deb apt update apt install zabbix-agent - Configure the agent in
/etc/zabbix/zabbix_agentd.confto point to your Zabbix server's IP address. - Add the new host in the Zabbix UI. It will automatically apply the "Linux by Zabbix agent" template, immediately collecting hundreds of metrics.
This self-managed approach aligns with a strategy of maintaining full control and data ownership over critical operational metrics.
Key Features:
- Auto-Discovery & Templating: Automatically discover network devices and apply pre-configured monitoring templates.
- Flexible Data Collection: Supports agents, SNMP, IPMI, JMX, and custom scripts.
- Advanced Alerting: Highly customizable trigger conditions, escalations, and notification channels.
- Visualization Tools: Create complex graphs, network maps, and SLA reports.
Pros:
- Completely free and open-source with no licensing costs.
- Extremely flexible and scalable for large, complex environments.
- Strong community support and optional commercial support available.
Cons:
- Requires significant administrative overhead for setup, tuning, and maintenance.
- The user interface and configuration workflows can feel less modern than SaaS alternatives.
Website: https://www.zabbix.com/
7. Nagios XI
Nagios XI is the commercial, enterprise-grade edition of the open-source Nagios Core, a long-standing and trusted name in IT infrastructure monitoring. It provides a comprehensive GUI, powerful reporting, and configuration wizards that simplify the process of monitoring servers, network devices, services, and applications. As one of the more traditional server performance monitoring tools, Nagios XI appeals to organizations that prefer a self-hosted solution with a one-time perpetual license.
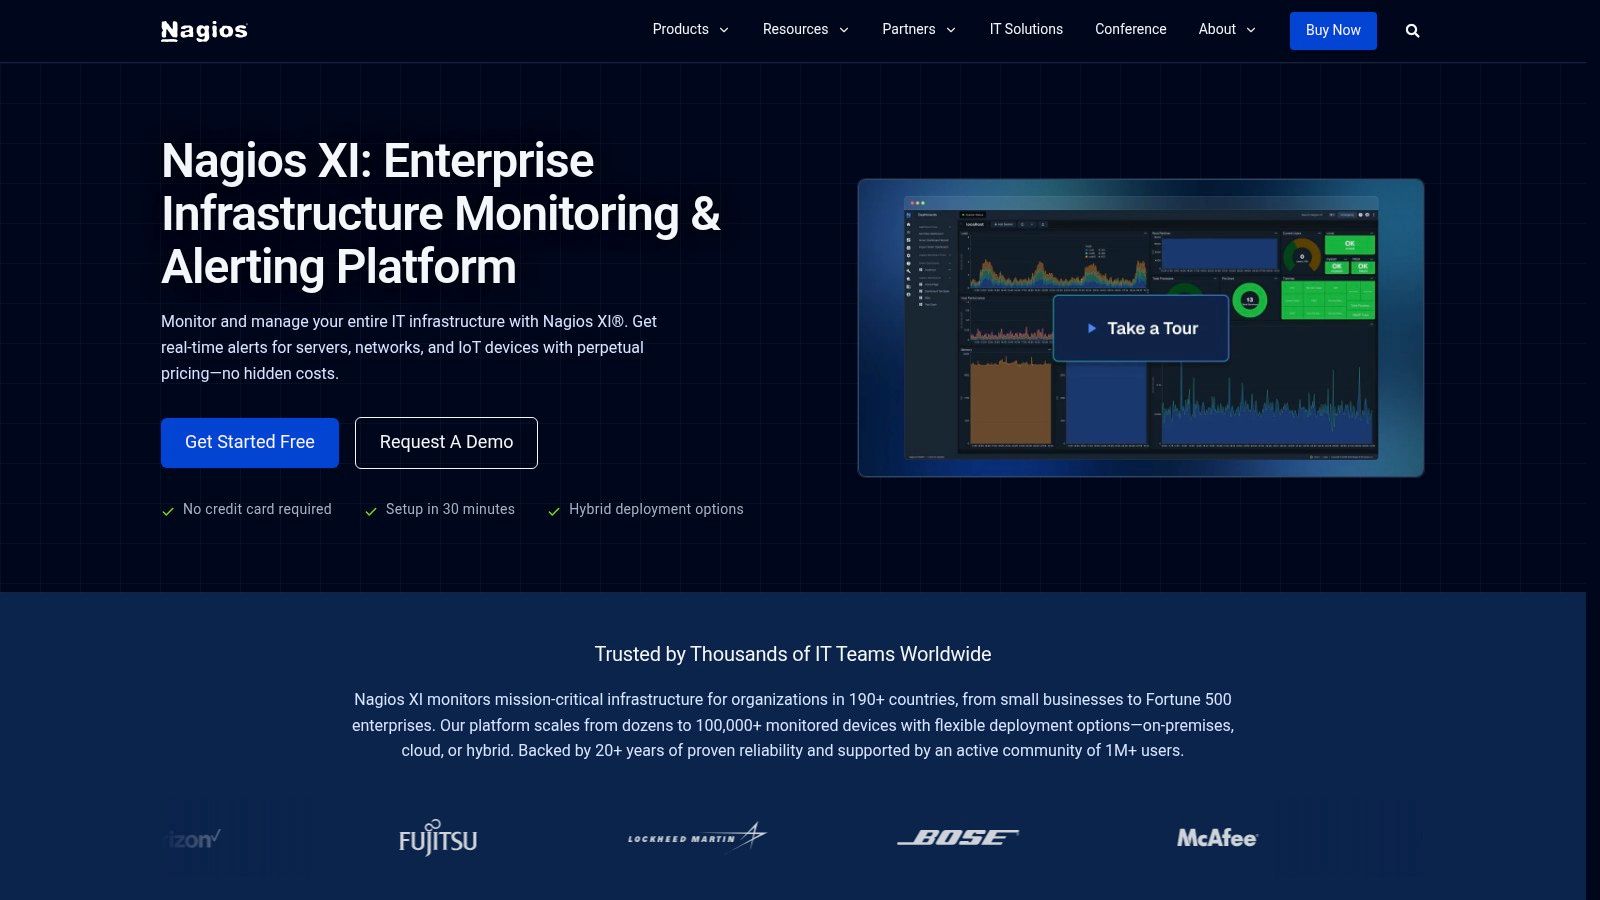
Its core strength lies in its extensive plugin ecosystem, which allows it to monitor virtually anything from standard Linux/Windows server metrics to specific application health checks. The platform is known for its reliability and granular control over monitoring checks and alerting thresholds. While it requires more hands-on management compared to modern SaaS platforms, this control is precisely what many system administrators in established IT environments value.
How to Implement Nagios XI on an ARPHost Server (Example)
Nagios XI is ideal for system administrators and IT teams managing traditional on-premise infrastructure. For an organization using ARPHost's bare metal servers or a custom Proxmox Private Cloud, Nagios XI can be deployed on a dedicated management VM.
- Install Nagios XI Server on a clean CentOS/RHEL VM by following the official installation guide.
- Deploy the NCPA agent (Nagios Cross-Platform Agent) on the target ARPHost server to be monitored.
- Use the "NCPA Agent" configuration wizard in the Nagios XI web interface. Enter the server's IP address and the agent's token.
- Select the metrics you want to monitor, such as CPU usage, memory, disk space, and specific running processes. Nagios XI will automatically create the necessary service checks.
This setup provides deep, agent-based monitoring of all server resources, network services, and application uptime. The buy-once licensing model is particularly attractive for budget-conscious organizations.
Key Features:
- Configuration Wizards: Over 70 configuration wizards and templates simplify setup.
- Extensible Architecture: A massive ecosystem of community and official plugins.
- Advanced Reporting: Includes capacity planning, SLA, and scheduled reports.
- Customizable Dashboards: Create role-specific views for different teams.
Pros:
- Perpetual licenses offer a predictable, buy-once cost model.
- Highly extensible and customizable to fit specific monitoring needs.
- Well-established and proven in traditional IT environments.
Cons:
- Setup and configuration can be heavier than modern SaaS tools.
- Scaling, maintenance, and high availability are managed by the customer.
Website: https://www.nagios.com/products/nagios-xi/
8. Paessler PRTG
Paessler PRTG (Paeßler Router Traffic Grapher) is an all-in-one, sensor-based monitoring solution that has long been a staple in network and systems administration. As one of the most established server performance monitoring tools, its strength lies in its simplicity and breadth of coverage, especially within Windows environments. It offers both on-premise (PRTG Network Monitor) and cloud-hosted (PRTG Hosted Monitor) versions, catering to different operational models.
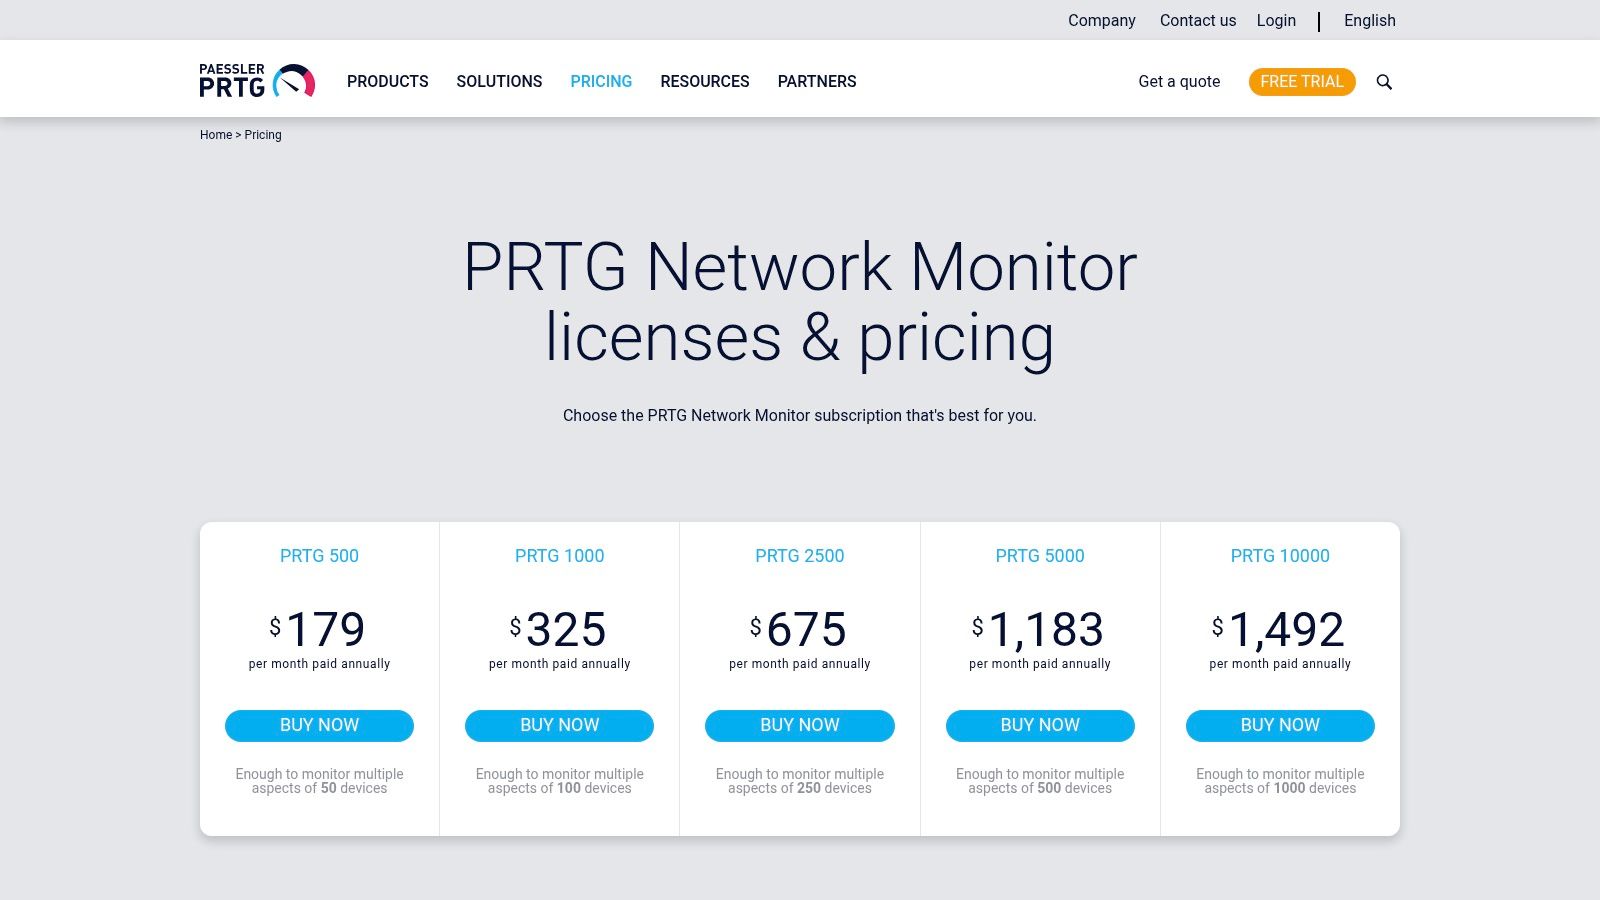
The platform operates on a 'sensor' model, where each sensor monitors one specific aspect of a device, like CPU load, memory usage, or network traffic on a particular port. This granular approach allows administrators to build a highly customized monitoring setup. PRTG includes a vast library of pre-built sensors for common hardware, operating systems, and applications, which are discovered automatically upon network scanning, significantly speeding up deployment.
How to Implement PRTG on an ARPHost Server (Example)
PRTG is an excellent fit for businesses that need a comprehensive but straightforward tool without a steep learning curve. For a business using ARPHost's bare metal servers to host custom Windows applications:
- Install PRTG Network Monitor on a dedicated Windows Server VM.
- Run the Auto-Discovery wizard and provide the IP range of your ARPHost servers and relevant credentials (e.g., WMI for Windows).
- PRTG automatically identifies the servers and adds relevant sensors like "CPU Load," "Memory," "Ping," and "Disk Free Space."
- You can manually add more specific sensors, such as "HTTP" to check a website's uptime or "SQL Server" to monitor query performance.
The simple, sensor-based licensing model is predictable and cost-effective for growing infrastructures.
Key Features:
- Auto-Discovery: Automatically scans your network to identify devices and recommend relevant sensors.
- Pre-built Sensors: A massive library of sensors for OS metrics, virtualization (VMware, Hyper-V), applications, and hardware.
- Maps and Dashboards: Create custom, real-time maps and dashboards to visualize network and server topology.
- Flexible Alerting: Threshold-based alerts via email, SMS, push notifications, and script execution.
Pros:
- Straightforward licensing model based on sensor count is easy to understand and budget for.
- Extremely strong support for the Windows ecosystem and network devices.
- Fast and easy setup with powerful auto-discovery features.
Cons:
- Licensing costs can escalate quickly in large or complex environments requiring many sensors.
- The web interface can feel dated compared to modern cloud-native platforms.
- Advanced analytics and AIOps capabilities are less extensive than top-tier SaaS suites.
Website: https://www.paessler.com/pricing
9. SolarWinds
SolarWinds provides a powerful suite of monitoring and observability tools known for their deep capabilities in traditional IT environments. As one of the most established server performance monitoring tools, it offers both self-hosted (Server & Application Monitor) and SaaS (SolarWinds Observability) deployment models, catering to diverse operational needs. Its strength lies in detailed infrastructure monitoring, especially for Windows-based estates, physical data centers, and complex networks.
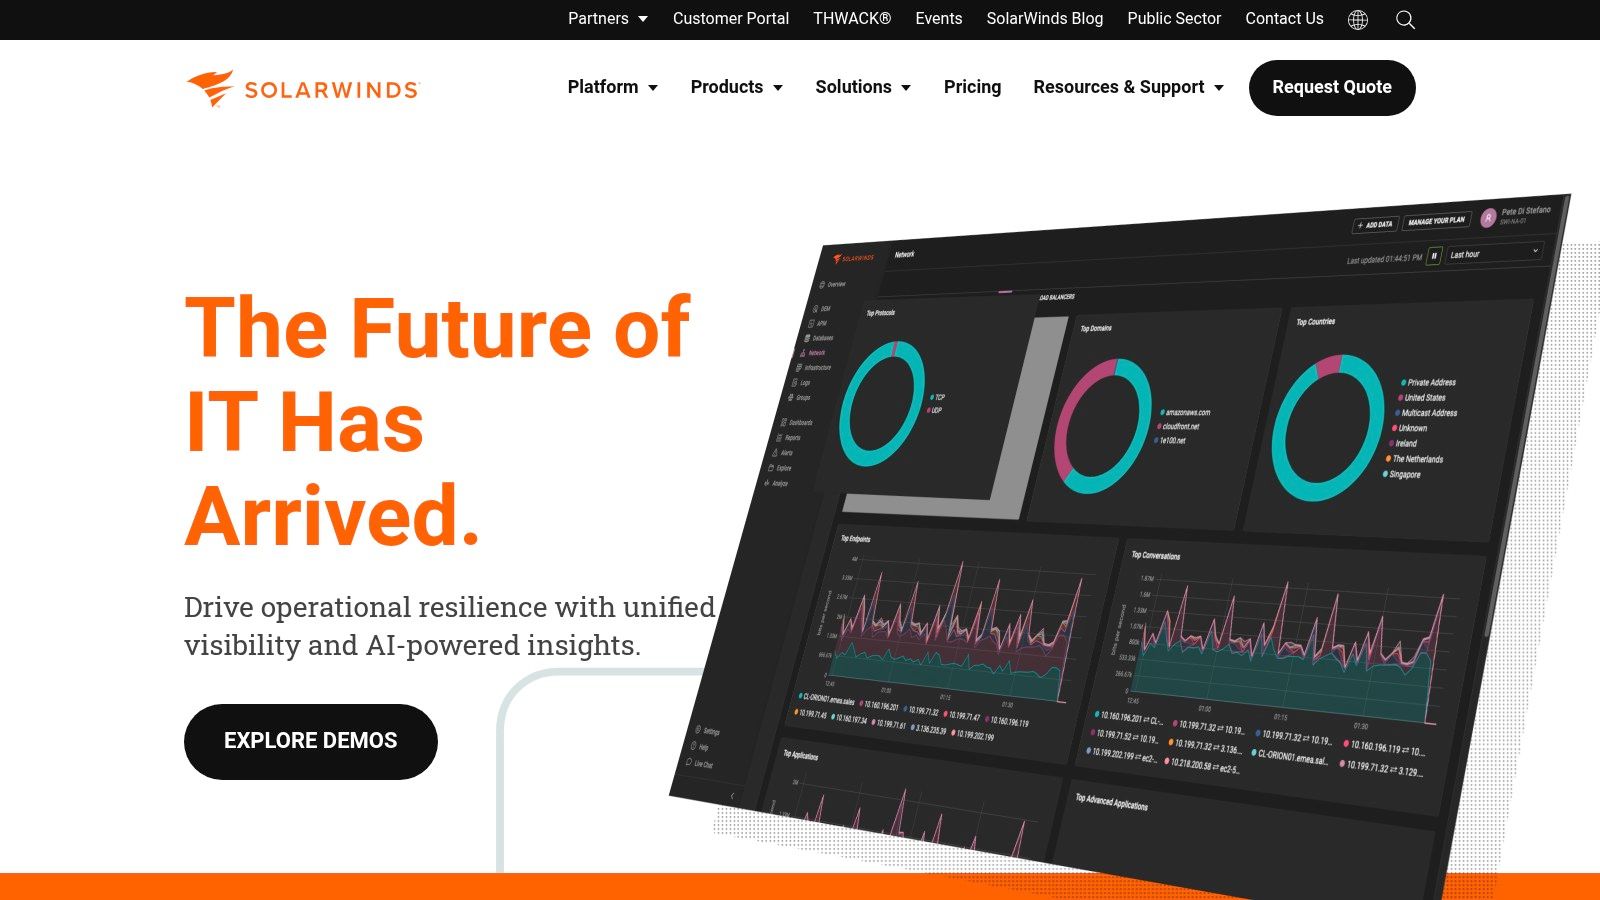
The platform is distinguished by its cross-stack correlation feature, PerfStack, which allows IT professionals to drag and drop metrics from different sources onto a single timeline to diagnose root causes. This visual approach to troubleshooting is highly effective for identifying dependencies between servers, applications, and network devices. Its node-based licensing model is straightforward for environments with a predictable number of physical or virtual servers.
How to Implement SolarWinds on an ARPHost Server (Example)
SolarWinds is an excellent fit for IT teams managing on-premise data centers or hybrid environments. For an organization leveraging ARPHost's colocation services, SolarWinds' on-premise solution can provide granular control.
- Set up the SolarWinds Platform on a dedicated server within your colocated rack.
- Use the Network Sonar Discovery wizard to scan your subnet and discover devices via SNMP, WMI, or ICMP.
- Add discovered nodes (your ARPHost bare metal servers) to be managed. If agents are required for deeper insights, deploy the SolarWinds agent to each server.
- Utilize PerfStack to correlate network latency from your Juniper firewall (also monitored by SolarWinds) with CPU spikes on a specific web server, quickly diagnosing performance issues.
This setup allows businesses to maintain full ownership of their monitoring data while benefiting from ARPHost's secure and reliable infrastructure foundation.
Key Features:
- Infrastructure & Application Monitoring: Comprehensive server health, process, and service monitoring.
- PerfStack™ Correlation Dashboards: Visually correlates time-series data from across the stack.
- Network Performance Monitor: In-depth network path analysis and device health monitoring.
- Flexible Deployment: Available as a self-hosted solution or a fully managed SaaS platform.
Pros:
- Strong capabilities for traditional Windows and data-center infrastructure.
- Flexible deployment options cater to different security and management needs.
- Powerful data correlation and visualization tools for root cause analysis.
Cons:
- Onboarding and configuration can be complex in large, distributed estates.
- Can be less intuitive for modern, cloud-native workloads compared to specialized tools.
Website: https://www.solarwinds.com/
10. ManageEngine OpManager
ManageEngine OpManager is a powerful on-premises solution that provides integrated network, server, and virtualization monitoring. It is one of the more traditional server performance monitoring tools, ideal for organizations that prefer to keep their monitoring data in-house and require a unified view of both physical and virtual infrastructure. Its strength lies in offering a comprehensive feature set for a mixed IT environment under a straightforward, device-based licensing model.
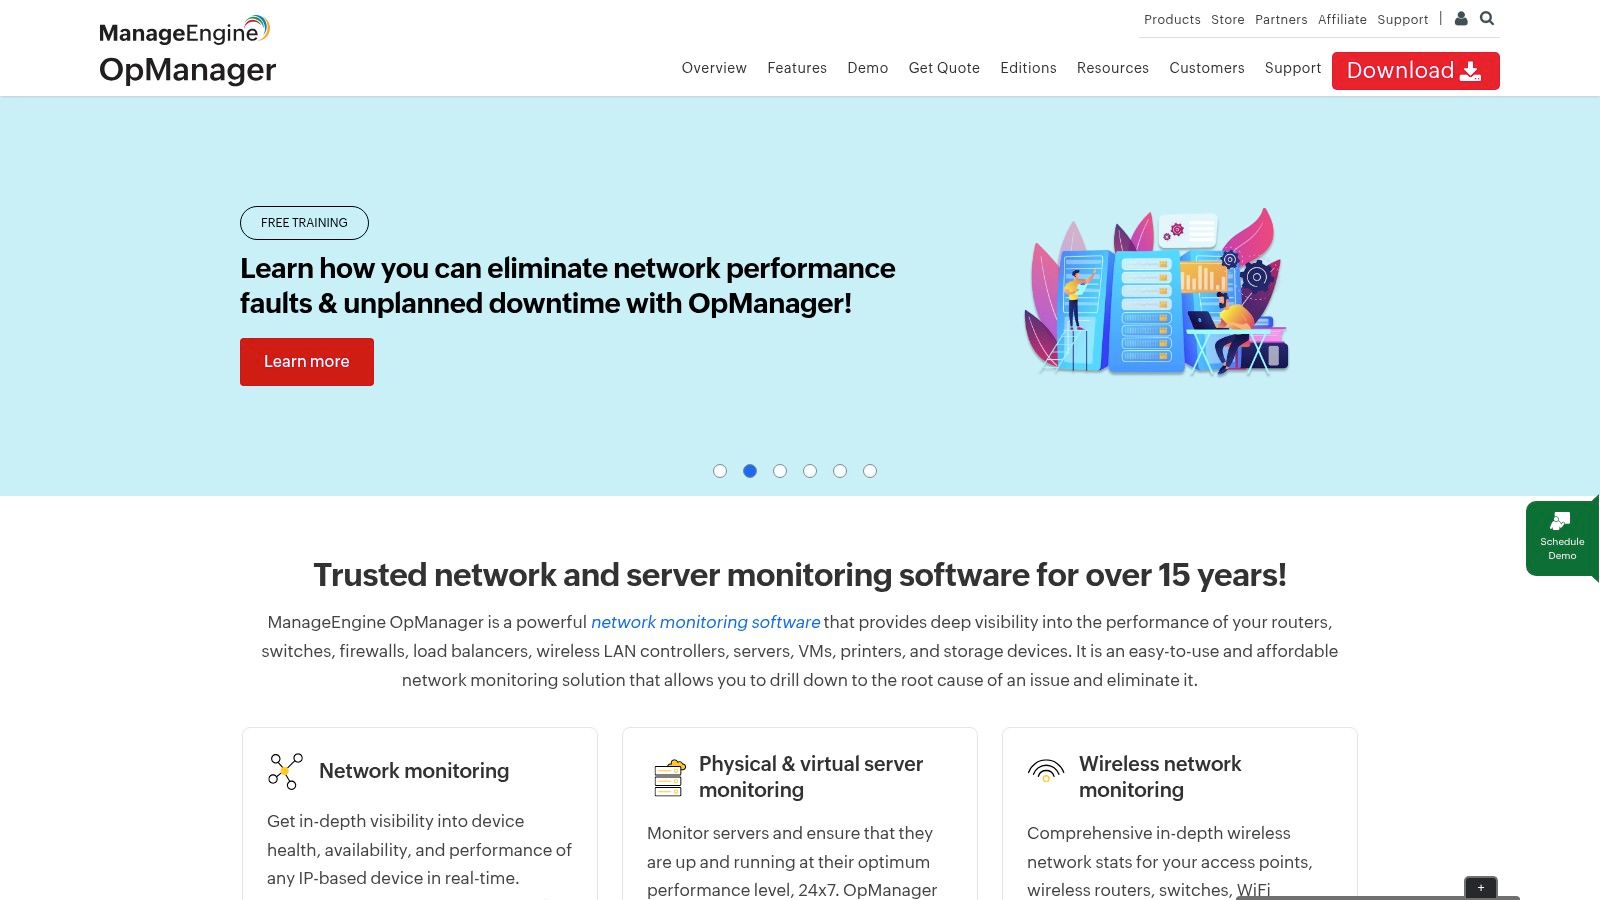
The platform excels at discovering and mapping your entire IT infrastructure, providing customizable dashboards and topology maps that give administrators a clear overview of device health and performance. With support for over 2,000 performance metrics, OpManager can track CPU, memory, and disk utilization on Windows and Linux servers, as well as monitor the performance of VMware and Hyper-V hosts and VMs. Its workflow automation engine helps teams automate routine IT management tasks, reducing manual effort.
How to Implement OpManager on an ARPHost Server (Example)
OpManager is well-suited for businesses with significant on-premises infrastructure. For a business running its own Proxmox Private Cloud from ARPHost:
- Install OpManager on a dedicated VM within your Proxmox cluster.
- Add your Proxmox host(s) as devices in OpManager, providing SSH or SNMP credentials. This allows monitoring of the hypervisor itself.
- For guest VMs, add them individually using their respective credentials (WMI for Windows, SSH/SNMP for Linux).
- Create a business view dashboard that maps out the Proxmox host and its dependent guest VMs, providing a clear visual representation of the entire virtual stack's health.
This self-hosted approach gives IT teams complete control over their monitoring data and configuration.
Key Features:
- Server & Network Monitoring: Real-time monitoring for servers, routers, switches, and firewalls.
- Virtualization Monitoring: In-depth performance tracking for VMware vSphere, Microsoft Hyper-V, and Citrix XenServer.
- Bandwidth Analysis: Monitors network traffic and helps identify bandwidth hogs.
- Configuration Management: Automates network device configuration and backups.
Pros:
- Competitive and transparent device-based pricing model.
- Broad monitoring capabilities for mixed server and network environments.
- Strong support for on-premises and virtualized infrastructure.
Cons:
- Initial setup and device discovery can be complex and time-intensive.
- Lacks some of the advanced AI and cloud-native features of its SaaS competitors.
Website: https://www.manageengine.com/network-monitoring/
11. Amazon CloudWatch
Amazon CloudWatch is the native observability service for AWS, offering a suite of monitoring capabilities tightly integrated with the AWS ecosystem. As one of the default server performance monitoring tools for any workload running on AWS, it provides essential metrics, logs, and alarms for services like EC2 instances, RDS databases, and Lambda functions. Its primary advantage is the seamless, agentless data collection for AWS resources, making it the path of least resistance for teams fully invested in the AWS cloud.
The platform has evolved beyond basic metrics to include Logs Insights for powerful query analysis, Synthetics for canary testing, and a unified agent for gathering OS-level metrics from EC2 instances or even on-premise servers. Dashboards are customizable, allowing you to centralize key performance indicators from across different services into a single view. The alarming system is robust, with integrations into SNS for notifications and Auto Scaling for automated responses.
How to Implement CloudWatch on an ARPHost Server (Example)
While native to AWS, the CloudWatch agent can monitor on-premise or external servers. For a business using ARPHost for a hybrid-cloud strategy—perhaps a Proxmox private cloud for sensitive workloads and AWS for scalable web frontends:
- Create an IAM user in AWS with the
CloudWatchAgentServerPolicyand generate access keys. - Install the CloudWatch agent on your ARPHost server.
- Configure the agent (
/opt/aws/amazon-cloudwatch-agent/bin/amazon-cloudwatch-agent-config-wizard) to collect desired metrics (e.g., CPU, memory) and logs. It will prompt for your IAM access key and secret key. - Start the agent. Your ARPHost server will now appear alongside your EC2 instances in the CloudWatch dashboard, providing a unified view for your hybrid setup.
Key Features:
- Unified Agent: Collects OS-level metrics from EC2 and on-premise servers.
- Logs Insights: A powerful query engine to search and analyze log data.
- Alarms & Events: Triggers automated actions and notifications based on metric thresholds.
- Synthetics Canaries: Monitors application endpoints and user-facing workflows.
Pros:
- Deep, native integration with all AWS services.
- Pay-as-you-go pricing model can be cost-effective for smaller workloads.
- No data egress fees for metrics sent from AWS services.
Cons:
- Pricing can become complex and unpredictable, with costs across metrics, logs, and alarms.
- Less intuitive for multi-cloud or on-premise monitoring without significant configuration.
Website: https://aws.amazon.com/cloudwatch/
12. Netdata Cloud
Netdata Cloud combines an open-source agent with a SaaS control plane to deliver high-granularity, real-time infrastructure monitoring. It stands out as one of the most efficient server performance monitoring tools for teams that need immediate, per-second visibility into system health without complex configuration. Its lightweight agent auto-discovers metrics, generating comprehensive dashboards automatically upon installation.
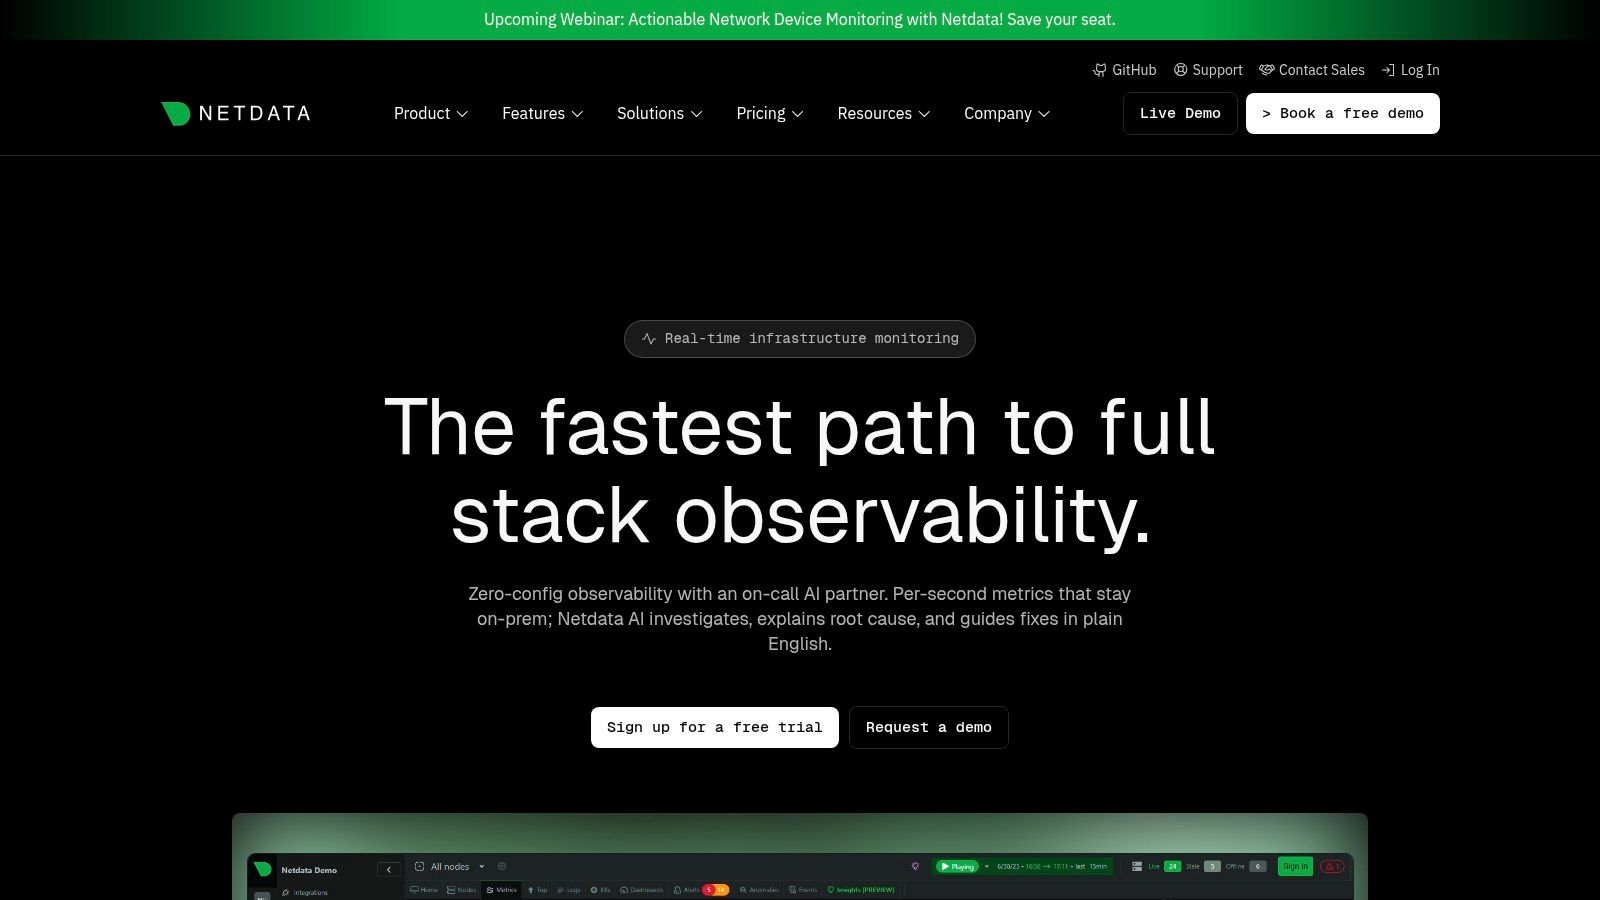
The platform is engineered for speed and simplicity, making it a favorite among DevOps engineers and system administrators who value rapid deployment and low overhead. Netdata collects unlimited metrics and logs directly at the node, which can then be visualized and managed through its centralized cloud UI. Features like AI-assisted troubleshooting help teams diagnose anomalies faster by automatically correlating metrics and identifying root causes.
How to Implement Netdata Cloud on an ARPHost Server (Example)
Netdata Cloud is an excellent fit for startups or developers running applications on ARPHost’s High-Availability VPS hosting. Its one-liner installation provides instant visibility with one-second granularity.
Sign up for a free Netdata Cloud account.
SSH into your ARPHost VPS and run the kickstart installation script provided by Netdata:
wget -O /tmp/netdata-kickstart.sh https://get.netdata.cloud/kickstart.sh && sh /tmp/netdata-kickstart.shThe script installs the agent, which automatically detects all running services (like Nginx, MySQL, etc.) and starts collecting thousands of metrics.
Claim the node by running the provided claim command in your terminal. Your VPS will now appear in your Netdata Cloud space, streaming real-time metrics.
This ensures that any performance bottlenecks on KVM-based virtual servers are identified and resolved quickly, maintaining optimal application responsiveness.
Key Features:
- Per-Second Granularity: Real-time monitoring with data points collected every second.
- Automated Dashboards: Pre-built, zero-configuration dashboards for hundreds of services.
- AI-Powered Investigations: AI-assisted troubleshooting to accelerate root cause analysis.
- Centralized Control Plane: Manage alerts, users (RBAC/SSO), and nodes from a unified cloud interface.
Pros:
- Simple, predictable per-node pricing model.
- Extremely fast deployment and low agent resource consumption.
- Open-source agent provides transparency and community support.
Cons:
- Its SaaS model is newer compared to long-established enterprise vendors.
- Advanced AI features may require purchasing credits beyond the included sessions.
Website: https://www.netdata.cloud/
Server Performance Monitoring: 12-Tool Comparison
| Solution | Core features | Quality ★ | Price / Value 💰 | Target audience 👥 | Standout ✨/🏆 |
|---|---|---|---|---|---|
| Datadog | Metrics, APM, logs, synthetics, RUM; 850+ integrations | ★★★★ | 💰 Add‑on modules; can be costly at scale | DevOps & multi‑cloud teams | 🏆 Extensive integrations & analytics; fast time‑to‑value ✨ |
| New Relic | Unified metrics/events/logs/traces, NRQL, synthetics | ★★★★ | 💰 Usage‑based + generous free tier | SMBs → Enterprises wanting transparent billing | ✨ NRQL for ad‑hoc analysis; predictable usage model 🏆 |
| Dynatrace | Davis AI, Smartscape topology, deep K8s & code visibility | ★★★★★ | 💰 Predictable subscriptions; enterprise pricing | Large, complex distributed systems | 🏆 Causation‑based detection & automation ✨ |
| Grafana Cloud | Managed Prometheus (metrics), Loki (logs), Tempo (traces), Grafana UI | ★★★★ | 💰 Free tier; retention/usage limits on lower plans | Teams wanting Grafana UX without infra ops | ✨ Familiar Grafana experience; FedRAMP option 🏆 |
| Prometheus | Pull‑based scraping, PromQL, exporters, Alertmanager | ★★★★ | 💰 Open‑source (self‑hosted scaling costs) | Kubernetes/container‑native teams | ✨ Full control & huge exporter ecosystem 🏆 |
| Zabbix | Auto‑discovery, agents/agentless, maps, SLA reporting | ★★★★ | 💰 No license fees; optional commercial support | Large on‑prem environments preferring OSS | ✨ Mature enterprise OSS feature set 🏆 |
| Nagios XI | GUI wizards, plugins, reporting, enterprise add‑ons | ★★★ | 💰 Perpetual licenses (buy‑once) available | Traditional IT shops needing node licensing | ✨ Plugin ecosystem & buy‑once model 🏆 |
| Paessler PRTG | Sensor‑based monitoring, auto‑discovery, maps/dashboards | ★★★★ | 💰 Sensor‑count licensing; straightforward pricing | SMBs / Windows‑heavy estates | ✨ Easy setup & strong Windows support 🏆 |
| SolarWinds | Node licensing, PerfStack correlation, topology/path views | ★★★★ | 💰 Node‑based pricing; self‑hosted or SaaS options | Data‑center & Windows‑centric enterprises | ✨ Cross‑stack correlation; flexible deployment 🏆 |
| ManageEngine OpManager | Device licensing, VMware/Hyper‑V monitoring, dashboards | ★★★ | 💰 Competitive pricing for core monitoring | SMB → Enterprise mixed server & network estates | ✨ Broad device support & device‑based licensing 🏆 |
| Amazon CloudWatch | Native AWS metrics/logs/alarms, synthetics, Internet Monitor | ★★★★ | 💰 Pay‑as‑you‑go across metrics/logs/checks | AWS‑first workloads | 🏆 Deep AWS integration; no internal AWS egress ✨ |
| Netdata Cloud | Per‑second metrics, cloud control plane, AI investigations | ★★★★ | 💰 Flat per‑node pricing; predictable costs | Teams needing real‑time per‑node insights | ✨ Per‑second granularity & rapid deploy 🏆 |
Scaling This with ARPHost: Pairing the Right Tools with Expert Management
Navigating the landscape of server performance monitoring tools can feel overwhelming. From the expansive, AI-driven platforms of Datadog and Dynatrace to the highly customizable, open-source powerhouses like Prometheus and Zabbix, the options are as diverse as the environments they monitor. The key takeaway from our deep dive is this: the "best" tool isn't a one-size-fits-all solution. Instead, it’s the one that aligns precisely with your technical stack, budget, team expertise, and scalability goals.
Your selection process should be a strategic exercise. For a startup running on a lean budget, combining Prometheus with Grafana on an ARPHost VPS (starting from $5.99/month) offers unparalleled power, provided you have the in-house expertise to manage it. Conversely, a large enterprise running a complex Dedicated Proxmox Private Cloud (starting at $299/month) might find the total cost of ownership lower with an all-in-one solution like New Relic or SolarWinds, which simplifies observability and reduces the management burden on internal teams.
Why ARPHost Excels Here
Ultimately, a monitoring tool is just that—a tool. It generates data, alerts, and dashboards. The real value comes from interpreting that data and taking proactive, informed action. This is where the synergy between advanced server performance monitoring tools and expert management becomes undeniable.
- Proactive Management: We don't just install a monitoring agent on your secure managed VPS or Proxmox private cloud; we become your dedicated infrastructure guardians. Our expert team configures, manages, and responds to alerts 24/7, ensuring that potential issues like CPU bottlenecks, memory leaks, or disk I/O latency are addressed before they impact your users.
- Integrated Security: Our Secure Web Hosting Bundles include Imunify360 and CloudLinux OS, hardening the server at the core. Monitoring tools can then focus on performance, knowing the security foundation is solid.
- Holistic Solutions: Our expertise extends beyond servers to managed network services for Juniper devices and administration of Virtual PBX phone systems. We can monitor and manage your entire IT stack, not just isolated components.
- Hands-on Support: Unlike hyperscalers, we provide 24/7 expert support from engineers who understand your specific setup. Whether it's a routine patch or a complex performance investigation, we're here to help.
This transforms monitoring from a reactive task into a proactive strategy for achieving true operational resilience and peak performance. To effectively implement these tools, it's often beneficial to utilize services that include robust system status monitoring as a foundational component.
Ready to pair powerful monitoring with expert, hands-on management? The team at ARPHost, LLC provides fully managed IT services that integrate best-in-class monitoring directly into your hosting solution, from secure VPS hosting to dedicated Proxmox private clouds.
- Explore our Secure VPS Bundles at arphost.com/vps-web-hosting-security-bundles/
- View Proxmox Private Cloud plans at arphost.com/proxmox-private-clouds/
- Request a quote for managed services at arphost.com/managed-services/