

You're reviewing a failed login alert after business hours, but the alert doesn't tell you whether it's a password mistake, a compromised administrator account, or the first step in lateral movement. Start by correlating identity, endpoint, network, and cloud telemetry in one incident workflow. A practical response is to validate the account activity, isolate the affected endpoint or workload when the evidence supports compromise, preserve the relevant logs, and escalate through a documented playbook.
That workflow is the difference between security monitoring services and a dashboard that merely collects events. The service has to identify meaningful behavior, investigate it in context, contain the risk, and report what happened.
Table of Contents
- What Security Monitoring Services Actually Do
- Core Components and Telemetry Stack
- Managed Monitoring versus In-House Operations
- How to Choose the Right Security Monitoring Service
- Pricing Models and Realistic SLA Expectations
- Integration with Hosting, Backup, and Virtualization Environments
- Implementation Steps and Operational Rollout
- Common Pitfalls and How to Avoid Them
What Security Monitoring Services Actually Do
An administrator signs in after hours. The identity provider records a successful login after repeated failures, an endpoint starts an unfamiliar process, a firewall detects an unusual outbound connection, and a cloud audit log shows access to a sensitive resource. Each signal needs context. Together, they may support revoking the session, isolating the endpoint, and opening an incident before the activity spreads.
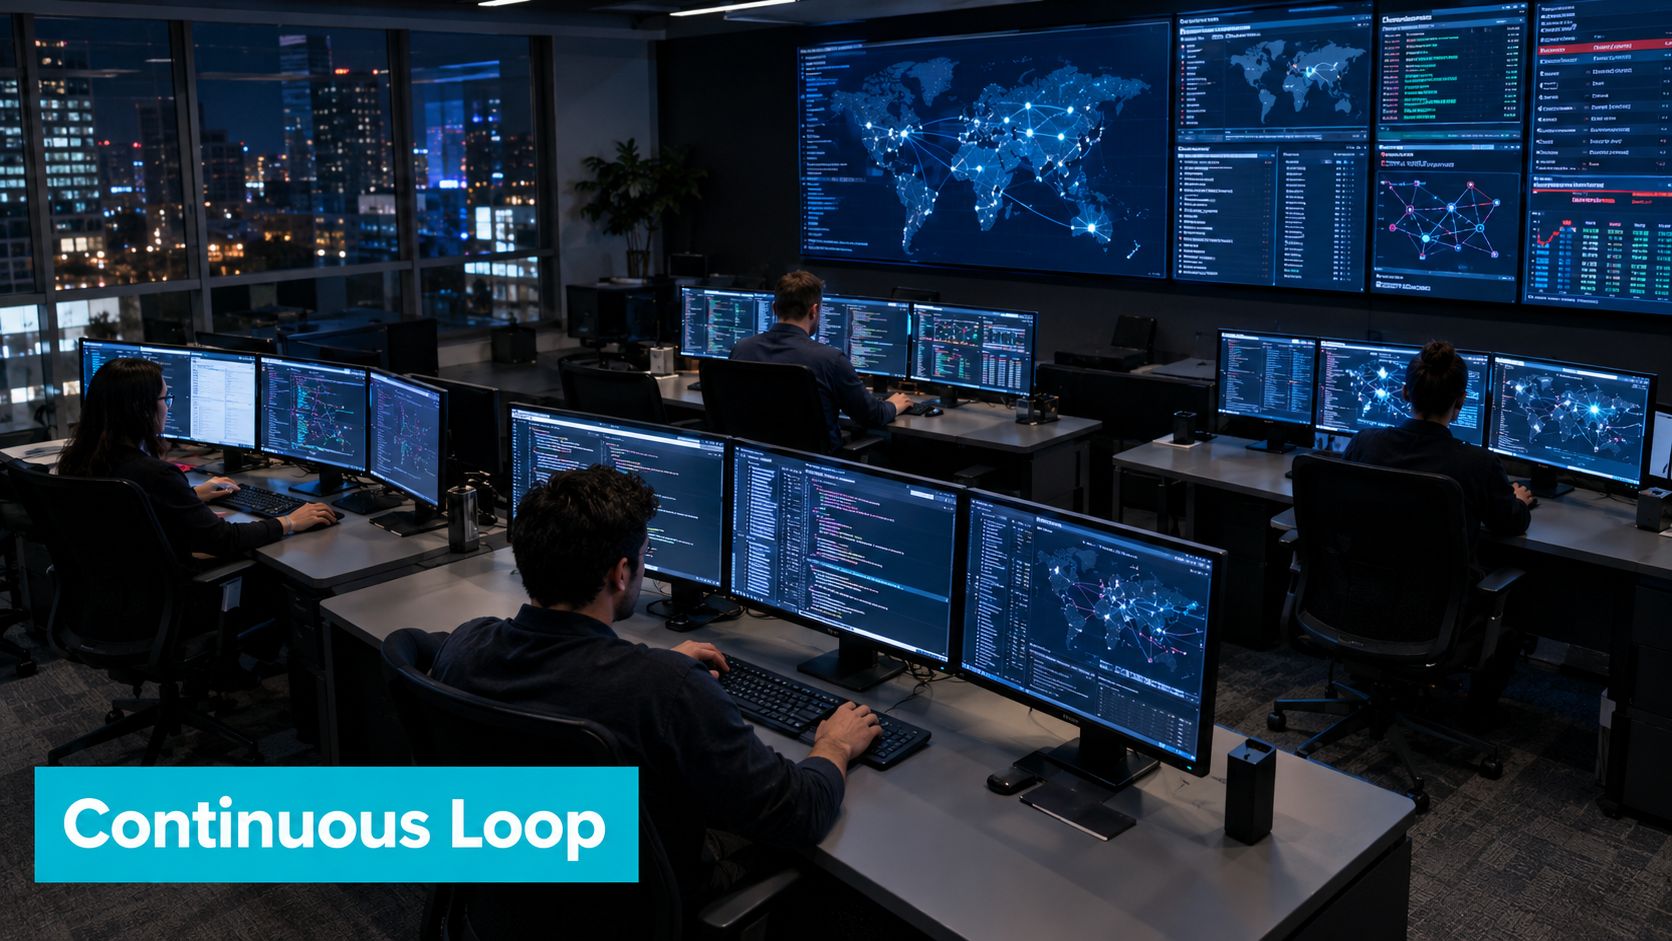
Security monitoring services coordinate five operating tasks:
- Collect: Ingest logs and signals from identity systems, endpoints, firewalls, applications, cloud workloads, and network sensors.
- Detect: Apply rules, behavioral analysis, and threat intelligence to identify activity that needs review.
- Investigate: Correlate events by account, host, process, IP address, workload, and time.
- Respond: Follow an approved playbook, such as revoking a session, isolating a host, or disabling a credential.
- Report: Document the evidence, actions, owner, and outcome for operations, leadership, and compliance.
A dashboard can stop at detection. An operating service continues until an analyst determines whether the event matters and an authorized person or team decides what happens next. Ambiguous cases need human review. Serious events need defined escalation paths, response authority, and documented ownership, especially when containment could interrupt a customer workload.
The market reflects this recurring operational role. A U.S. industry report estimates the Security Services market at $51.5 billion in 2026, with 108,000 businesses operating in the sector and a 0.7% CAGR from 2021 to 2026. The industry report places security monitoring within an ongoing service category rather than a one-time alarm installation.
Practical rule: A service earns its place by enabling a clear action after an alert fires.
Hosting teams should match monitoring scope to the systems they run. ARPHost's 24/7 server monitoring service may cover availability and resource conditions, while security monitoring also requires identity, process, access, and network telemetry. The handoff between those signals determines whether an operator sees an isolated warning or a defensible incident picture.
Core Components and Telemetry Stack
A useful telemetry stack has layers because each layer sees a different part of the attack path. Network detection and response, or NDR, identifies unusual connections, scanning, and traffic patterns. Endpoint detection and response, or EDR, adds process creation, file activity, persistence, and host isolation. Identity threat detection and response, or ITDR, focuses on authentication, privilege, session, and account behavior.
A SIEM remains valuable as the correlation and investigation layer. It normalizes events, retains evidence, and connects activity across systems. It shouldn't be treated as a substitute for the sensors that produce meaningful signals. Poor endpoint coverage or incomplete cloud audit logging leaves the SIEM with cleanly indexed blind spots.
| Telemetry Type | Primary Use Case | Coverage Impact |
|---|---|---|
| Network detection and response | Suspicious traffic, scanning, command and control, lateral movement | Extends visibility between systems and workloads |
| Endpoint detection and response | Processes, files, persistence, host isolation | Shows what actually executed on a machine |
| Identity threat detection and response | Logins, privilege changes, session abuse | Connects account activity to access risk |
| SIEM and log management | Correlation, search, retention, investigation | Creates a central evidence trail |
| Cloud workload telemetry | Control-plane actions, workload behavior, storage access | Covers cloud-specific permissions and activity |
Coverage should be measured against techniques and outcomes, not event volume. One expert benchmark estimates that SIEM-only coverage can be as low as 21% of MITRE ATT&CK techniques, while combining SIEM with EDR, NDR, and ITDR can raise coverage above 70%. Vectra's security monitoring guidance provides that comparison and explains why broader telemetry produces deeper detection.
The operational scorecard should include mean time to detect, mean time to respond, attacker dwell time, and ATT&CK coverage. A log pipeline that ingests everything but generates untriaged alerts has high volume and weak security value. Use ARPHost's infrastructure monitoring best practices as an adjacent operational reference, then map each production asset to the telemetry it needs.
Managed Monitoring versus In-House Operations
In-house monitoring gives your team direct control over detection rules, infrastructure context, and response decisions. It also makes your organization responsible for staffing, shift coverage, escalation, tuning, retention, analyst training, and the unpleasant overnight alerts that arrive when nobody is fresh.
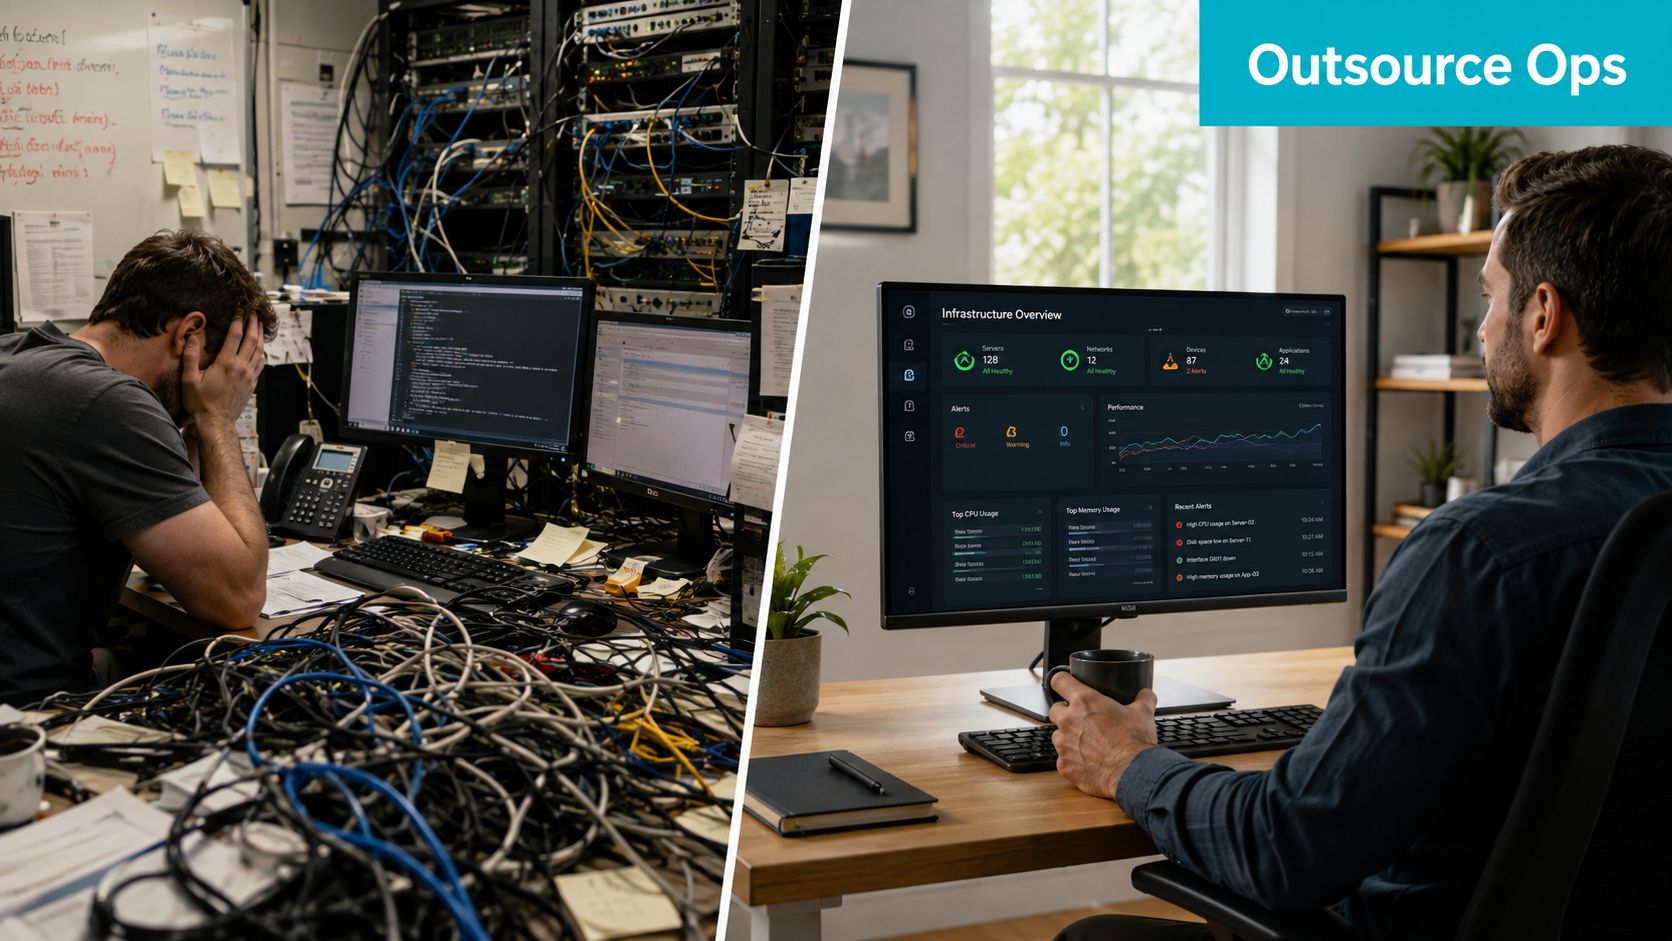
The choice is not only between buying a platform and hiring a vendor. It's a choice between building an operating capability and assigning part of that capability to another team.
| Operating Model | Strengths | Operational Cost |
|---|---|---|
| In-house SOC | Direct context, internal control, custom workflows | Staffing, coverage, training, tooling, and on-call burden |
| Managed detection and response | External investigation, tuning, and escalation capacity | Requires integration, trust, clear authority, and provider oversight |
| Hybrid model | Internal ownership of business decisions with outsourced investigation support | Handoffs can fail if roles and response authority aren't documented |
A mature internal team makes sense when it already has dedicated security operations staff, established incident response, and enough infrastructure knowledge to investigate cloud, endpoint, and identity events. A small team without those capabilities may reduce risk faster by outsourcing investigation while retaining ownership of business-impact decisions.
The division of responsibility should be explicit. The provider can triage, enrich, investigate, and recommend containment. Your team should define critical assets, acceptable disruption, legal requirements, and who can authorize actions such as disabling an account or isolating a production host.
Overnight coverage is a staffing claim, not a logo on a service page. Ask who investigates alerts, what happens during handoff, and how escalation is tested.
This managed service provider versus outsourcing comparison is useful when the decision includes broader infrastructure duties. Security monitoring should be evaluated with the same discipline as hosting or IT operations.
A provider may advertise continuous coverage while relying heavily on automation or minimal overnight staffing. Request an escalation matrix, sample incident timeline, analyst-to-alert workflow, and evidence of regular rule tuning before signing.
How to Choose the Right Security Monitoring Service
Start with coverage, not the feature list. Ask the provider to identify which assets produce telemetry, which ATT&CK techniques are covered, and which events require a human investigation. A credible answer should distinguish collected data from actual detection logic.

Use this selection sequence:
- Map your environment: List identity providers, operating systems, endpoints, firewalls, SaaS platforms, cloud accounts, hypervisors, backup systems, and critical applications.
- Test integration readiness: Confirm supported agents, APIs, syslog paths, retention, time synchronization, and access controls before procurement.
- Request coverage evidence: Ask for an ATT&CK coverage map and examples of detections across identity, endpoint, network, and cloud telemetry.
- Inspect the response workflow: Require a sample incident showing alert enrichment, analyst notes, escalation, customer notification, containment authority, and closure criteria.
- Put performance into the SLA: Define severity, measurement start and stop points, exclusions, escalation windows, and reporting obligations.
SLA math gets vague when providers don't define the clock. “Response time” might mean the first automated acknowledgment, the first analyst review, or completed containment. Those are different events, so the contract should name each one.
Integration quality matters as much as detection quality. If an EDR agent can't run on a legacy server, cloud logs aren't enabled, or identity events arrive without consistent usernames, the service may look complete while missing the activity that matters.
A practical trial should include a controlled detection test approved by your team. Verify that the event arrives, receives the expected severity, links to related activity, reaches the right person, and leaves an auditable record. Don't accept a slide deck as proof of operational coverage.
Pricing Models and Realistic SLA Expectations
A monitoring quote can look inexpensive once you map the full scope of its coverage. Providers commonly price by device, user, data volume, workload, or service tier. Managed IT and hosting companies may bundle monitoring with administration, patching, vulnerability scanning, or support. That can simplify procurement, but the contract must separate uptime checks from security detection and incident response.
| Monitoring Service Tiers and Typical Inclusions | Coverage Scope | Response Model |
|---|---|---|
| Infrastructure monitoring | Availability, resources, services, and basic system health | Automated notification with operational escalation |
| Security event monitoring | Identity, endpoint, network, and selected cloud events | Triage, enrichment, and severity-based investigation |
| Managed detection and response | Broad telemetry, detection engineering, investigation, and playbooks | Human-led response with defined escalation and containment procedures |
A low fee may reflect fewer telemetry sources, shorter evidence retention, or no active investigation. A higher fee can make sense when it includes detection engineering, response authority, compliance reporting, and integrations that an internal team would otherwise build and maintain. Compare those line items rather than using price as a proxy for quality.
For cloud workloads, practical guidance sets performance expectations of under 15 minutes MTTD for high-severity alerts and under 60 minutes MTTR for confirmed incidents. Palo Alto Networks' managed detection and response guidance cites these targets as useful benchmarks.
SLA math depends on the clock definition. State whether MTTD begins when an event occurs or when the platform receives it. State whether MTTR ends at analyst acknowledgment, containment, eradication, or service restoration. Also define exclusions for unavailable logs, customer-caused delays, and approved maintenance.
Faster detection and containment reduce the time an attacker can move between network, endpoint, and cloud systems. They also give responders a clearer operating record: the initial signal, related activity, isolated assets, and unresolved risk.
European procurement data places the 2026 market price for Security Monitoring Services at €81.72 per month, with prices rising at a 0.922285 CAGR from 2023 to 2026. The procurement benchmark offers market context, not a quality guarantee. Buyers should compare telemetry, analyst work, retention, escalation, and response authority before accepting a quoted rate.
Integration with Hosting, Backup, and Virtualization Environments
Monitoring should follow the deployment architecture, not an idealized diagram. In a Proxmox environment, that means collecting relevant host, guest, authentication, firewall, storage, and backup activity. In managed hosting, it may also include control-panel events, web server behavior, file integrity signals, and service-level alerts.
Use four integration checks:
- Virtualization: Separate host compromise from guest activity, and preserve the relationship between a VM, its node, its storage, and its management account.
- Hosting: Monitor administrative access, service changes, web processes, file activity, and resource anomalies without treating every traffic spike as a security incident.
- Backup: Alert on failed jobs, unexpected policy changes, deleted recovery points, and access by accounts that don't normally manage backups.
- Private cloud: Include control-plane actions, identity changes, network policy changes, and workload events in the same investigation timeline.
Backup monitoring isn't a replacement for backup validation. After ransomware or a configuration failure, the team needs evidence that recovery points exist, remain accessible, and can restore the affected workload. Keep backup credentials separate from ordinary administrator credentials, and alert when that separation changes.
The practical architecture is a chain:
Hosts and workloads
        |
        v
Agents, syslog, APIs, cloud audit logs
        |
        v
Collection and normalization
        |
        v
Correlation and detection
        |
        v
Human triage and response playbooks
        |
        v
Ticketing, escalation, recovery, and reporting
ARPHost operates services including Proxmox private clouds and managed infrastructure. The relevant question for any provider is whether its monitoring can see the control plane and the guest workloads, then connect security events to operational response.
Implementation Steps and Operational Rollout
Implementation works best as a controlled rollout. Begin with an asset inventory and mark critical systems, administrative identities, internet-facing services, cloud accounts, hypervisors, and backup infrastructure. Then record the telemetry source, owner, retention requirement, and response contact for each asset.
Build the first monitoring slice
Start with identity, endpoint, firewall, and cloud audit data from a representative production group. Provision least-privilege access, synchronize timestamps, verify log delivery, and confirm that sensitive records are protected in transit and at rest.
Configure thresholds from normal operating ranges. A rule that fires on every administrator login creates noise. A rule that detects an administrator account created by a non-admin has clearer operational significance. Guidance on alert thresholds explains why baselines and acceptable ranges are more useful than arbitrary static limits.
Verify before expanding
Use approved test events and confirm the complete path from source to analyst. Check that severity, asset identity, enrichment, notification, ticket creation, and escalation all work as intended.
sudo journalctl --since "15 minutes ago" -p warning..alert --no-pager
sudo ss -tupn
sudo systemctl --failed
These commands don't replace a security platform, but they provide a fast host-level check during validation. Compare the output with the events your collector receives, then expand coverage in stages.
Document every rule, exception, owner, and rollback action. If a new rule creates a false-positive storm, disable or revert that rule, preserve the test evidence, and keep existing collection active. Never roll back by deleting logs or removing the only access path to the monitoring system.
Common Pitfalls and How to Avoid Them
Automation alone isn't 24/7 security monitoring. A script can classify an event, but it usually can't resolve conflicting evidence, understand a maintenance window, or decide whether isolating a production host creates greater business risk. Effective coverage combines continuous telemetry, human investigation, escalation paths, and response playbooks. Operational guidance on round-the-clock SOC monitoring highlights the danger of treating an “always on” label as proof of meaningful overnight staffing.
Alert fatigue is the next failure. Aggressive thresholds produce queues that analysts learn to ignore, while loose thresholds hide important activity. Tune rules against baselines, separate informational events from actionable incidents, and review exceptions after changes to applications, identities, and network policy.
Raw log volume is a vanity metric. A better operational review asks whether the service can detect, investigate, and contain relevant behavior across the assets that matter. MITRE ATT&CK coverage, MTTD, MTTR, dwell time, escalation quality, and playbook completion tell you more than the number of records stored.
Severity-based routing keeps the queue usable:
- Critical: Multiple failed logins followed by success, an administrator account created by a non-admin, firewall disablement, cryptominer-like execution, or production database access from an unknown IP should trigger immediate handling. DevSecOps monitoring guidance lists these as examples of critical events.
- High: Brute-force activity, unusual API use, after-hours administrative access, large data exports, and privilege escalation need prompt investigation, generally within hours according to the same guidance.
- Routine: Low-confidence anomalies and expected configuration changes should remain searchable and documented without interrupting every on-call engineer.
Test detections regularly, update playbooks after incidents, and review whether the response reduced exposure. If the service can't show what it detected, who acted, and why the incident closed, it isn't measuring security operations.
ARPHost, LLC provides managed infrastructure with proactive monitoring, security updates, vulnerability scanning, network-level intrusion detection, and security audits. If you need monitoring aligned with VPS, bare metal, hosting, or private cloud operations, visit ARPHost, LLC to discuss an environment-specific setup.

Leave a Reply
You must be logged in to post a comment.