

A site goes quiet on a Linux VPS. SSH still feels slow. The application team says the database is timing out, but the web server logs don't show anything obvious. In that moment, you don't start by changing configs or restarting services. You start by asking a simpler question.
Can this system reliably reach what it needs to reach?
That's why Ping for Linux still matters. It's basic, but basic doesn't mean shallow. Used well, ping tells you whether a problem is local, remote, intermittent, protocol-specific, or tied to path quality instead of outright failure. It helps you separate “host is down” from “host is up but the network path is ugly.”
On a modern hosting stack, that distinction matters. A single command can help you troubleshoot a VM-to-gateway issue, verify whether a private cloud node can reach storage, or confirm that a public service is reachable over the right IP family. If you work through Linux networking often, it also helps to keep broader terminology straight. A concise reference like the Vulnsy network reconnaissance glossary is useful when you need to align diagnostics language across ops, security, and support teams.
If your first check shows inconsistent reachability from a server with a recent network change, verify the host's addressing before you go deeper. A quick review of setting a static IP in Linux often saves more time than chasing imaginary application bugs.
Your First Step in Network Diagnostics
A production server starts dropping database connections after a routing change. SSH is slow, monitoring is noisy, and nobody knows whether the fault is the application, the host, or the path between them. ping is where the check starts because it answers the fastest question first: can this system send packets to the target and get replies back consistently?
On Linux, ping gives you a quick read on reachability, packet loss, and round-trip time over ICMP. That sounds basic, but on VPS nodes, bare metal, and private cloud networks, it helps narrow the fault domain before you touch services or configs. If a VM cannot reach its gateway, that points you in a very different direction than a host that replies cleanly but still times out at the application layer.
That distinction matters in managed hosting environments like ARPHost, where one symptom can come from several layers. A failed ping can point to routing, firewall policy, interface state, upstream filtering, or a bad address assignment. If a server was recently reconfigured, verify the host networking first with a guide on setting a static IP in Linux. Clean ping replies, on the other hand, usually mean the next check belongs at DNS, TCP, TLS, or the service itself.
ping also scales better than many admins expect. It is useful for a one-minute sanity check during an incident, but it is just as useful during maintenance windows, failover testing, and scripted health checks across larger fleets. On hosted infrastructure, I use it early to separate local host issues from upstream path issues before spending time on deeper packet captures or application logs.
A few patterns show up often in production:
- No reply at all. Check local addressing, routes, security groups, firewall rules, VLAN tagging, and whether ICMP is being filtered.
- Replies arrive, but timing is unstable. Check congestion, oversubscribed virtualization hosts, queueing, or a path change upstream.
- Replies look clean, but the service still fails. Shift focus to DNS resolution, port reachability, TLS negotiation, or the application stack.
Teams that work across ops and security also benefit from using the same terms during triage. The Vulnsy network reconnaissance glossary is a useful reference when you need shared language for reachability tests, probing, and follow-up investigation.
One rule is worth keeping: a successful ping proves reachability, not service health. That makes it the first step, not the last one.
Ping Command Fundamentals and Core Options
On a production host, the difference between a quick check and a useful check is usually one flag. A plain ping confirms basic reachability. The options turn it into something you can use during incidents, maintenance, and scripted monitoring across VPS, bare metal, or private cloud systems.
Start with the simplest form against a hostname or IP:
ping your-server-hostname
ping your-server-ip

That default behavior matters. On Linux, ping keeps running until you stop it, which makes it useful during a live change. If I am watching a route during a firewall update or waiting for a failed node to return, I want a continuous stream of replies instead of a one-shot test. You can interrupt it with Ctrl+C for final statistics, or use Ctrl+ on many Linux systems to print intermediate statistics without stopping the command.
Start with the default behavior
A continuous ping is good for short observation windows where the network may flap for a few seconds and then recover.
ping your-server-hostname
Use it while you restart a network service, move traffic to a standby node, or verify that a change on a hosted server did not introduce intermittent loss. In managed environments like ARPHost, this is often the first low-noise way to confirm whether the problem is local to the guest, tied to the upstream path, or already resolved.
Use -c when you need repeatable results
For scripts, ticket updates, and handoffs between admins, bounded tests are easier to compare. -c sets the number of echo requests and exits automatically.
Examples:
ping -c 1 your-server-hostname
ping -c 5 your-server-hostname
ping -c 10 your-server-hostname
Each count answers a different operational question:
-c 1checks basic reachability in a script or health probe-c 5gives a quick human-readable sample-c 10gives enough replies to catch obvious instability without waiting long
This is a trade-off. A count of one is fast, but it can miss intermittent loss. A count of ten is more useful during troubleshooting, but it slows down large batch checks if you are testing dozens of hosts.
Force IPv4 or IPv6 on dual-stack systems
Hostname resolution can hide the underlying problem on dual-stack servers. A service may look healthy because the hostname resolves over IPv4 while IPv6 is broken, or the reverse.
ping -4 your-server-hostname
ping -6 your-server-hostname
Use these options when:
- Some clients can connect, but others cannot
- You suspect broken IPv6 routing or filtering
- A hostname-based check passes, but user reports still point to partial reachability problems
In practice, this shows up often during migrations, firewall policy changes, or incomplete IPv6 rollouts. Testing both families separately saves time because it removes DNS preference and client stack behavior from the equation.
Control pace and waiting time
Two options matter a lot once you move from ad hoc checks to repeatable operations work.
ping -i 2 -c 5 your-server-hostname
ping -W 2 -c 5 your-server-hostname
| Option | What it changes | When to use it |
|---|---|---|
-i | Interval between probes | Reduce traffic during longer observation or spread out checks across many hosts |
-W | Reply wait time | Fail faster in scripts, cron jobs, and remote health checks |
-i is useful when you need to watch a path for several minutes without sending a packet every second. -W matters in automation because a slow timeout can stall the whole job. On a fleet of servers, that difference adds up fast.
For incident work, consistency matters more than clever flag combinations. Pick the same count, interval, and timeout across hosts so the results are comparable in your notes and alerts.
Admins do not need every ping option memorized. They need the small set that answers real questions under pressure. -c, -4, -6, -i, and -W cover most daily troubleshooting and give you a solid base for more targeted probing later.
Decoding Ping Results for Performance Analysis
Getting a reply doesn't mean the network is healthy. The value is in the details returned by ping, especially when a server is “sort of working” and users describe slowness rather than a total outage.
A documented Linux example shows what a clean result looks like. The command ping -c 10 -fq mango produced 10 packets transmitted, 10 packets received, 0% packet loss, and round-trip min/avg/max = 0.2/0.2/0.9 ms, as shown in this Linux Journal ping example. Those fields are the core of network quality analysis.
For quick orientation, this visual helps map each field to what it means in practice.
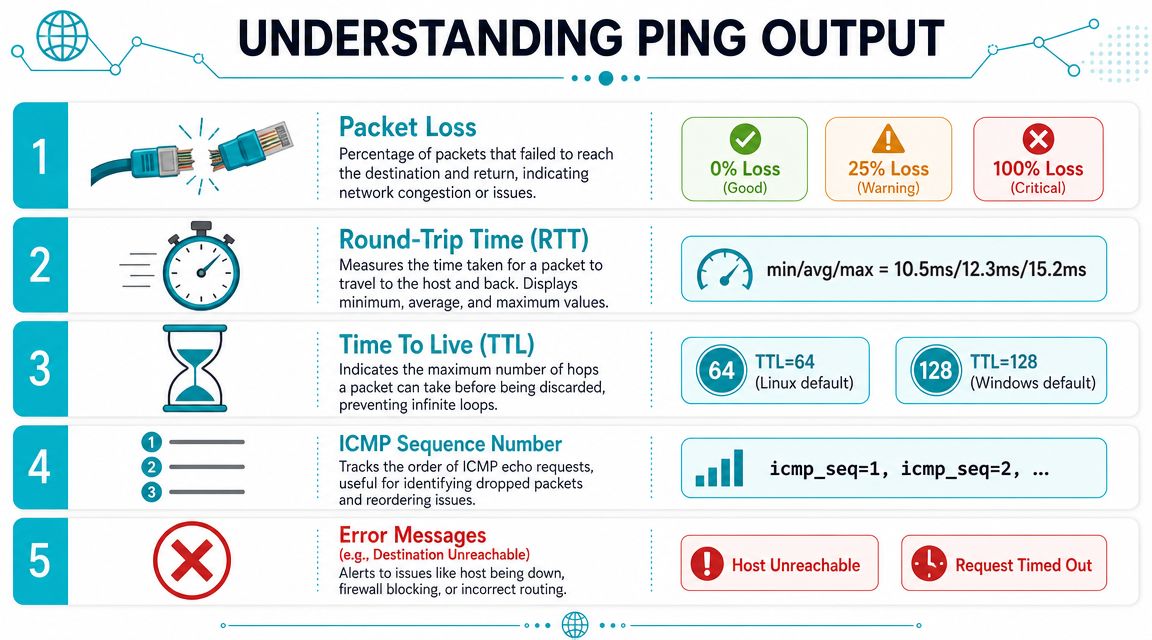
Read one response line like an admin
A typical reply line contains several clues:
- The responding host
icmp_seq, which tells you which request got a replyttl, which gives hints about the path and source stacktime=, which is the round-trip time
Example pattern:
64 bytes from target: icmp_seq=3 ttl=64 time=0.3 ms
You don't need to obsess over every field on every run. You do need to notice when one of them changes unexpectedly.
What the key metrics actually tell you
Here's the short version:
| Metric | What you're looking for | What trouble looks like |
|---|---|---|
| Round-trip time | Stable response time | Sudden spikes or wide swings |
| Packet loss | Consistent replies | Missing replies or repeated drops |
| TTL | Predictable hop behavior | Unexpected shifts that suggest path changes |
| Sequence numbers | Replies arrive in order | Gaps that show dropped probes |
Latency is easiest to understand if you think about a conversation. A healthy path answers quickly and consistently. A degraded path may still answer, but with hesitation. Web pages can still load that way, but users experience pauses, retries, and random sluggishness.
Packet loss is worse because applications often hide it badly. A browser may retry. A database client may pause and reconnect. A backup job may look stuck when it's really waiting on repeated retransmissions.
A host that responds with intermittent loss is often more dangerous than a host that doesn't respond at all, because teams keep blaming the application while the network quietly burns time underneath it.
Why the summary matters more than a single line
The final summary gives the broad view. Individual responses show instant behavior. The summary tells you whether the path stayed stable across the full sample.
In the Linux Journal example, the output included 10 packets transmitted, 10 packets received, 0% packet loss and round-trip min/avg/max = 0.2/0.2/0.9 ms. That's what a healthy bounded sample looks like in a small test window.
This walkthrough is worth watching if you want another visual explanation of output fields and common interpretations.
A practical reading model
When you review Ping for Linux output on a production server, ask these questions in order:
- Did every probe come back?
- Did replies stay in a narrow time range?
- Did TTL values look consistent?
- Did the path degrade only under a longer sample?
If the answer breaks at step one, focus on reachability. If it breaks at step two, focus on quality. That simple split prevents a lot of wasted troubleshooting.
Advanced Probing for Complex Network Issues
Basic ping tells you whether a host answers. Advanced ping helps you isolate why a path fails only in certain conditions. Junior admins often stop too early at that point.
Three scenarios come up often in hosted environments: MTU problems, multi-interface routing mistakes, and IPv6-specific failures.
Test for MTU and fragmentation problems
MTU issues are ugly because they often don't break everything. Small packets work. Larger application traffic fails, stalls, or behaves inconsistently. You'll see this in VPN paths, overlays, and virtualized networks where one segment is configured differently from the rest.
Use -s to set payload size and -M do to prevent fragmentation.
ping -c 5 -s 1400 -M do your-target
If smaller probes work and larger probes fail, that points toward a path MTU mismatch or a device that mishandles fragmentation.
A practical method is to test a few increasing sizes until failure appears:
ping -c 3 -s 1200 -M do your-target
ping -c 3 -s 1400 -M do your-target
ping -c 3 -s 1472 -M do your-target
You're not trying to produce a perfect benchmark. You're trying to learn whether packet size changes the outcome.
Don't run straight to application logs when large uploads fail but shell access feels fine. Test packet size first.
Bind to a specific interface
On multi-homed servers, ping without an interface can fool you. Linux may choose a route you didn't expect, especially on hosts with public and private uplinks, storage networks, or isolated back-end segments.
Use -I to bind the probe to a specific interface:
ping -I eth0 your-target
That lets you answer a sharper question: can this host reach that destination through this interface?
This is especially useful when you're comparing front-end and back-end paths, validating policy routing, or checking whether a private service network is healthy. If ping succeeds only from one interface, the issue usually sits in routing tables, firewall rules, or upstream switch policy.
When the question isn't “can I reach the host” but “is the service port reachable,” switch tools. A guide on checking if a port is open in Linux is the right next step once ICMP reachability is confirmed.
Validate IPv6 directly
Dual-stack systems create a specific kind of confusion. A hostname resolves, the service “works,” but some clients still fail. That often means one protocol family is healthy and the other isn't.
Use IPv6-specific testing directly:
ping -6 your-target
Or use ping6 on systems where that command is still provided:
ping6 your-target
If IPv4 works and IPv6 fails, don't call the issue random. It's usually one of these:
- Broken default route for IPv6
- Firewall policy that permits one family and blocks the other
- Missing neighbor discovery or gateway reachability
- A host listening correctly, but only being tested over the wrong family
A good escalation pattern
When standard probing isn't enough, use this order:
- Normal ping for reachability
- Forced family with
-4or-6 - Interface binding with
-I - Packet size testing with
-sand-M do
That sequence keeps you from skipping straight into guesswork. Most hard network incidents become easier once you stop treating connectivity as one single thing.
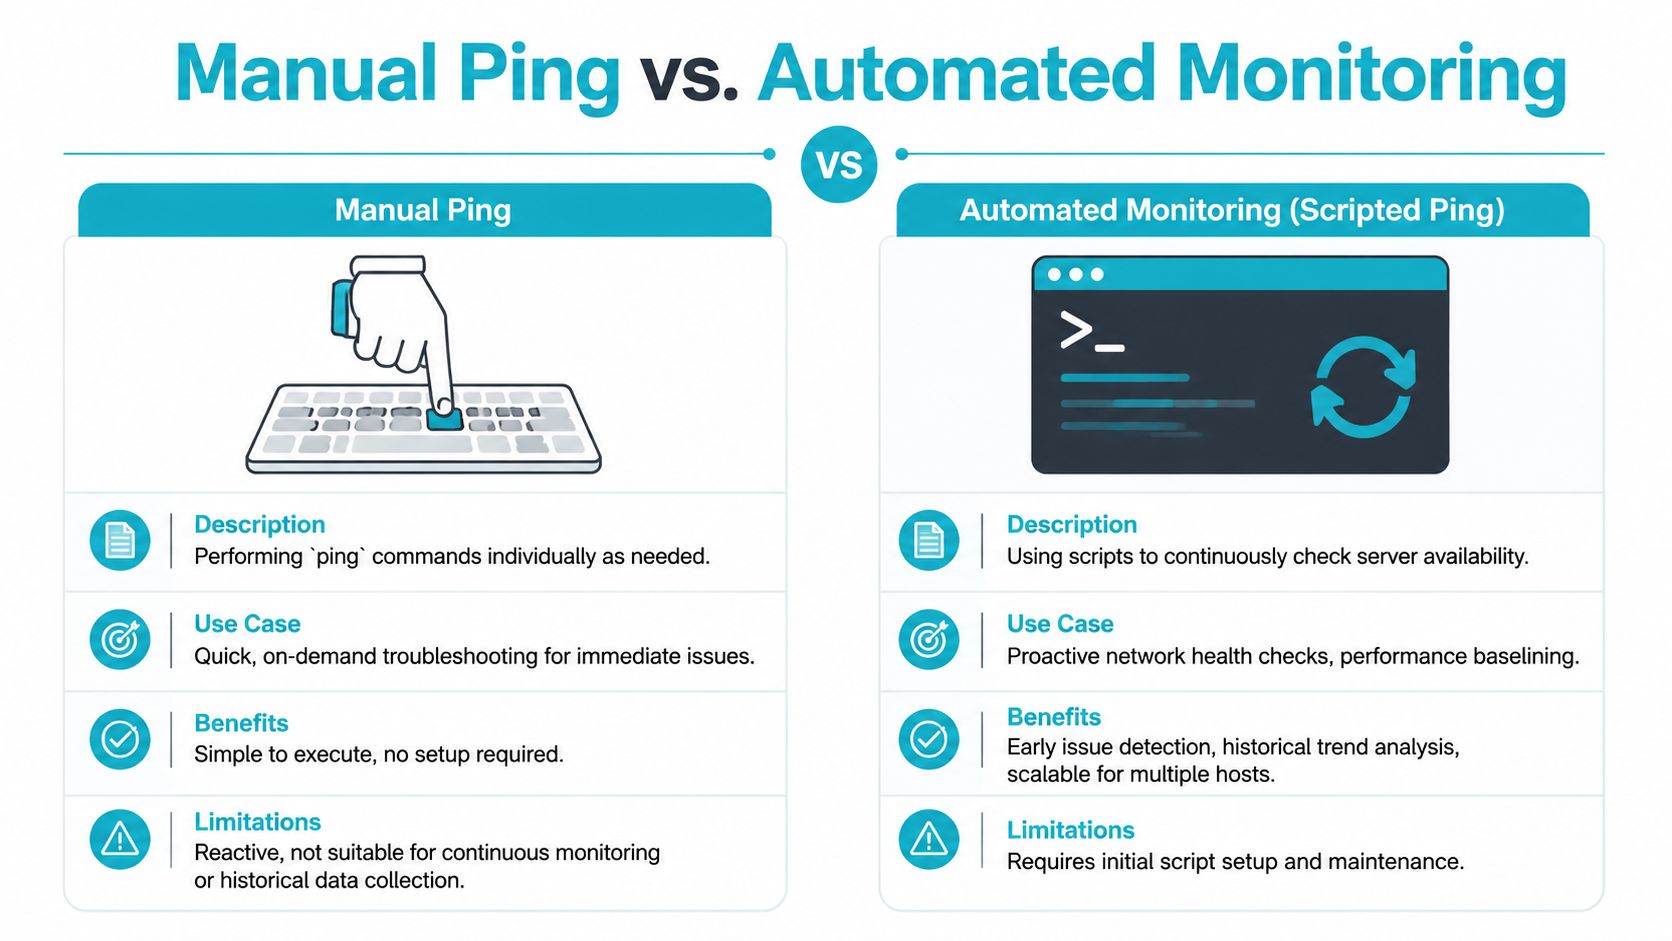
Automating Diagnostics and Using Ping Alternatives
Manual checks are fine during an active incident. They're weak as a monitoring strategy. If a service dropped at dawn and recovered before anyone logged in, a one-off ping at mid-morning won't tell you much.
Start with a small script. Keep it readable. Make it easy for another admin to maintain.
A simple Bash monitor
This example checks a short list of critical hosts and logs failures.
#!/bin/bash

HOSTS=(
  "web-gateway"
  "db-backend"
  "backup-node"
)

LOGFILE="/var/log/ping-watch.log"

for host in "${HOSTS[@]}"; do
  if ping -c 1 -W 2 "$host" > /dev/null 2>&1; then
    echo "$(date '+%F %T') OK    $host" >> "$LOGFILE"
  else
    echo "$(date '+%F %T') FAIL  $host" >> "$LOGFILE"
  fi
done
That's not a full monitoring platform, and it doesn't need to be. It gives you a starting point for scheduled checks with cron, systemd timers, or integration into a larger operations workflow.
A few practical improvements make it more useful:
- Add alerting by sending mail, posting to chat, or calling a webhook on failure.
- Separate host groups so storage, application, and edge systems don't all log to the same file.
- Record duration if you want to compare simple availability with response quality over time.
Where standard ping stops being enough
Plain ping does one thing well. It sends ICMP Echo Requests and reports how the path behaves. But some jobs need broader coverage or a different protocol.
Here's the field guide I give junior admins:
| Tool | Best use | Why you'd choose it |
|---|---|---|
ping | Single-host verification | Fast, universal, simple |
fping | Many hosts at once | Better for parallel reachability checks |
nping | TCP, UDP, and custom probes | Useful when ICMP isn't enough |
hping3 | Packet crafting and firewall testing | Better for policy validation and deeper experiments |
Choose the tool based on the question
If you're checking a fleet of systems, fping is usually a better fit than looping standard ping over dozens of hosts. It's built for parallel probing, which means less waiting and cleaner inventory-style checks.
If the firewall allows the application port but blocks ICMP, nping or another service-aware tool gives a more accurate answer. That matters when an app team says “the site is down” and your ping output says the host is fine. Both can be true.
hping3 sits in a different category. It's for situations where you need to craft packets, verify rule behavior, or test assumptions about filtering. Use it carefully. In the wrong hands, it creates noise faster than clarity.
Good diagnostics start with the lightest tool that can answer the question. If
pingtells you enough, stop there. If it doesn't, move sideways, not blindly deeper.
What works in production
A small scripted Ping for Linux workflow works well when you want:
- Quick host availability checks
- Basic logs for recurring incidents
- Simple external or internal health validation
It does not work well as your only monitoring layer when you need service awareness, long-term trend storage, or multi-protocol checks. At that point, treat ping as one sensor, not the whole system.
Optimizing Network Reliability with ARPHost
The point of learning ping well isn't to admire the command. It's to shorten outage time, reduce guesswork, and build cleaner escalation paths when something breaks.
On healthy infrastructure, ping becomes a confirmation tool more than a daily crutch. You use it to verify reachability, test path quality during maintenance, and quickly separate network faults from application faults. That's the ideal place to be. Your diagnostics stay sharp, but your environment doesn't force you into constant firefighting.
That's where infrastructure quality and ongoing operations discipline matter. Redundant paths, sensible routing, clean virtualization design, proactive monitoring, and fast human response all reduce the kinds of failures that ping exposes so clearly. If you're running customer-facing services, email systems, internal application stacks, or hybrid environments, that reliability isn't optional. It's part of the service itself.
Teams that don't want to troubleshoot every layer alone usually benefit from a provider that can support both infrastructure and operations. That includes hosts, networks, routing, patching, security controls, and escalation handling. If that's the direction you're evaluating, ARPHost's network and IT services are worth reviewing alongside your hosting requirements.
A few deployment models fit especially well when network reliability is the priority:
- VPS hosting for flexible application workloads with root access and controlled growth
- Bare metal servers when you want consistent hardware performance and direct control
- Dedicated Proxmox private clouds for isolated virtualization stacks and clearer operational boundaries
- Fully managed IT services when your team needs ongoing support rather than one-off hosting
The strongest operational posture combines both sides. Use solid tools like ping for fast diagnostics, then place critical workloads on infrastructure that minimizes the number of times you need emergency diagnostics in the first place.
If you're ready to move from reactive troubleshooting to a more dependable hosting and operations model, ARPHost, LLC offers VPS hosting, bare metal servers, private cloud platforms, colocation, instant applications, and fully managed IT services with hands-on support. You can review VPS hosting options, explore bare metal servers, evaluate managed services, or look at Proxmox private cloud solutions based on how much control and operational support your environment needs.