

The popular advice is to buy NVMe SSD storage whenever it's offered and expect every site to feel faster. Don't. If your bottleneck is CPU, a lock inside the application, or a single sequential stream, NVMe may change almost nothing. First confirm what you have, then measure latency under your real workload.
lsblk -d -o NAME,TRAN,MODEL
If TRAN reads nvme, the disk is attached over PCIe. If it reads sata, it isn't NVMe, whatever the control panel calls it. An empty TRAN usually means a virtual disk, so the guest can't see the host transport. That one check prevents most bad storage decisions. The gain from NVMe depends on I/O pattern, concurrency, sustained writes, and failure design, not on the label alone.
Table of Contents
- NVMe, SATA SSD and HDD Compared Side by Side
- Why NVMe Is Faster Through Queues and PCIe
- Which Workloads Gain the Most From NVMe
- Local, Ceph and Networked NVMe for Hosting
- Checking NVMe Endurance, Health and Timeouts With nvme-cli
- How to Benchmark and Migrate to NVMe Safely
- Confirm Your Storage Tier Before You Deploy
NVMe, SATA SSD and HDD Compared Side by Side
Sequential throughput hides the trade-off that decides hosting performance. A drive can stream large files fast and still stall on concurrent random reads. The table below separates transport limits from media behavior, so you can match the disk to the I/O pattern.
| Characteristic | SATA SSD | NVMe SSD | HDD |
|---|---|---|---|
| Interface and attachment | SATA III | PCIe x4 directly to CPU or chipset | SATA or SAS, mechanical |
| Command queues | 1 queue, depth 32 | Up to 64K queues, up to 64K commands each | 1 queue, NCQ depth up to 32 |
| Typical sequential read | About 550 MB/s | About 3,500 MB/s on PCIe 3.0 x4, about 7,000 MB/s on PCIe 4.0 x4 | Roughly 150 to 250 MB/s |
| Random access latency | Tens to low hundreds of microseconds | Tens of microseconds, varying by drive and queue depth | Several milliseconds for seek and rotation |
| Typical hosting use | General VPS and boot volumes | Databases, VM hosts, caching | Backup archives and bulk storage |
What Each Number Actually Means
SATA III tops out near 550 MB/s because the link and AHCI command model were designed around rotating disks. The flash inside can often do more, but the transport will not allow it. There is only one queue, so a busy host serializes work that could otherwise run in parallel. That serialization shows up as higher tail latency when dozens of processes submit I/O at once.
NVMe on PCIe 3.0 x4 reaches about 3,500 MB/s, and on PCIe 4.0 x4 about 7,000 MB/s, because the drive has a wider, direct path to the host. Real drives still sit below datasheet peaks. In an empirical evaluation of a PCIe-attached NVMe SSD, researchers measured up to 2.5 GB/s sequential read throughput and 800 MB/s write throughput using 4 KB operations. That gap between link rate and measured throughput is normal. Buy on random 4K behavior at your concurrency, not on the sequential number on the box.
A 7,200 RPM HDD manages roughly 150 to 250 MB/s sequential, which sounds usable until the workload turns random. Each random access pays seek time plus rotational delay, costing several milliseconds. A database index lookup that takes microseconds on flash can wait milliseconds on spinning disk. Under concurrency those waits stack fast.
Practical rule: Sequential speed sells drives. Random 4K performance and tail latency decide page generation time and database commit time.
The latency difference decides where NVMe pays. At low queue depths, NVMe writes complete far below one millisecond, while random reads still pay flash media access time that controller buffering cannot always hide. PHP workers, database indexes, VM metadata, and logs produce that concurrent random profile. That is where NVMe earns its cost. A single large file copied once a night will not show the same gain.
Confirm What Your Server Runs
Run this before you argue about upgrades.
lsblk -d -o NAME,TRAN,MODEL
lspci -nn | grep -i 'non-volatile'
The first command shows nvme or sata in TRAN for physical disks. The second lists NVMe controllers on the PCIe bus. Some virtual disks report an empty TRAN value, so on a VPS you may need to ask which pool the guest sits on. Tenants complain about slow sites, the panel says SSD, and the host turns out to be SATA with every guest queued behind one another. Check the transport first.
Why NVMe Is Faster Through Queues and PCIe
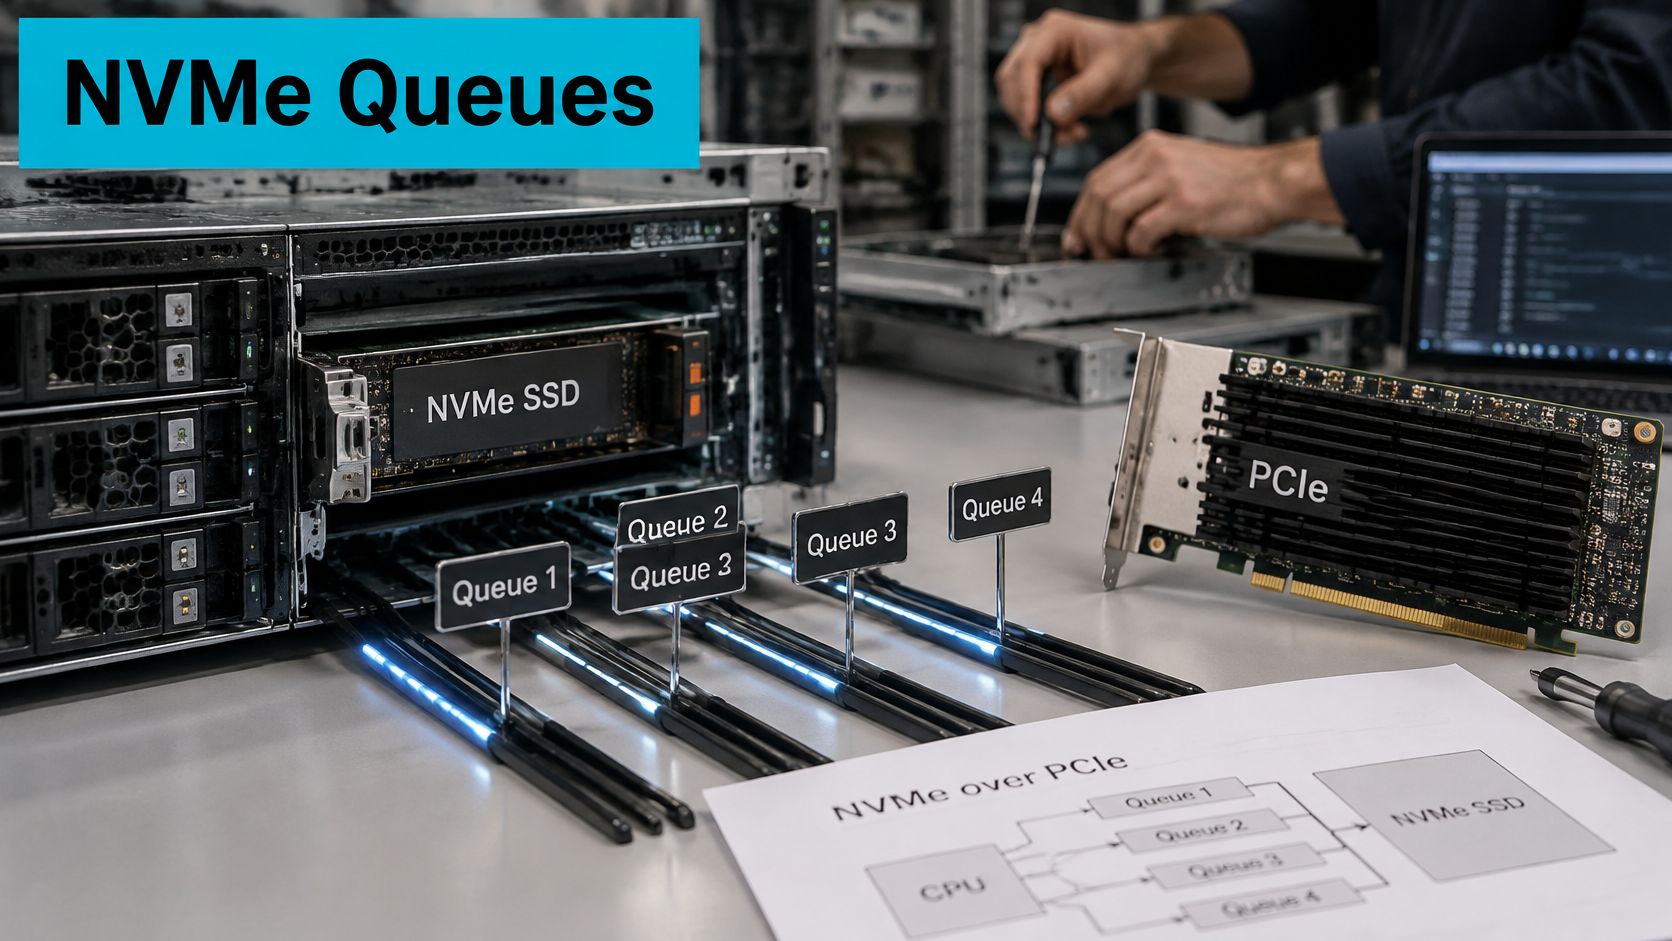
NVMe is a protocol built for PCIe flash, not a faster connector. According to the NVMe overview from NVM Express, NVMe was created as a storage interface specifically optimized for PCI Express solid-state drives, and the first specification, version 1.0, was released on March 1, 2011. It replaced assumptions inherited from protocols designed for rotating hard disks.
One Lane Versus Many Lanes
Think of AHCI as one checkout lane every shopper must join. NVMe provides up to 64K queues, each up to 64K commands deep, so many CPU cores can submit I/O without waiting on each other or on shared locks. A single threaded backup won't use that parallelism. Sixty virtual machines will.
The path is also shorter. The drive sits on PCIe lanes to the CPU or chipset, skipping the SATA controller hop, and the leaner software path cuts per I/O overhead in the kernel. Lower overhead per operation matters when a host issues hundreds of thousands of small operations per second, because CPU cycles spent on storage bookkeeping aren't available to guests.
Count the Queues on Your Host
You can see the actual queue layout instead of assuming it.
ls /sys/block/nvme0n1/mq
ls /sys/block/nvme0n1/mq | wc -l
Each directory is one hardware queue. The count depends on CPU core count and kernel version, so check the host in front of you. For example, a 16 core host commonly shows 16 queues. If a high core count host shows very few queues, that's worth investigating before you blame the drive.
The chain is short: CPU cores submit to queues, queues feed the controller, and the controller reads NAND channels in parallel. Flash was always parallel inside the package. NVMe finally lets the host feed it that way, which is why NVMe SSD storage scales with concurrency in a way SATA never could.
Which Workloads Gain the Most From NVMe
| Workload | Dominant I/O | Where NVMe helps | Metric to measure |
|---|---|---|---|
| PHP-FPM sites under concurrent traffic | Small random reads | High-concurrency page generation | r_await in iostat during peak traffic |
| PostgreSQL or MySQL under OLTP | Random reads and fsync writes | Commit latency and index lookups | w_await and commit latency from the database slow log |
| Proxmox or KVM host with many guests | Mixed random I/O | Guest disk latency and metadata operations | await per device in iostat |
| Mail queues and spool | Many small writes | Queue flush and delivery rate | await and time to drain the queue |
| Backup staging | Sustained large writes | Faster fill until the cache runs out | Throughput after 10 minutes of writes |
| Media transcoding | Large sequential reads and writes | Scratch space speed | Sustained MB/s during encode |
| AI/ML model loading and inference | Large sequential reads, many small files | Cold start and checkpoint load | Model load time and time to first token |
Three Patterns That Change the Decision
Small random reads gain most from low latency. Say a store runs 200 PHP workers, each reading templates, session files, and database pages. Every worker waits less per read, and the waits no longer queue behind a single SATA command queue. One worker on an idle staging site sees little difference, because there's no queue to clear.
Fsync heavy database writes gain from faster flushes. An OLTP commit isn't done until the write is durable, so lower write latency shortens every transaction. If you're tuning that path, work through database performance optimization alongside the storage change, because buffer settings and checkpoint behavior decide how much of the hardware gain you keep.
Long sequential writes depend on behavior after the SLC cache fills. Backup staging looks fast for the first minutes, then throughput falls once the cache is exhausted, and thermal throttling can cut it further. I would judge a drive for this job on throughput at minute ten, not minute one.
If the bottleneck is CPU, an application lock, or network throughput, NVMe won't move response time. Measure first, then spend.
Measure It on the Live System
Run this during peak load, not on an idle host.
iostat -x 1
Watch await and r_await per device. If await stays low while users still complain, the disk isn't your problem. If await climbs with queue depth during traffic, you've found storage contention. In production on multi-tenant hosts, the pattern is usually a few write heavy guests raising await for everyone else on the same device.
Large static media served through a CDN is poor value for NVMe. The CDN cache answers most requests, the origin disk sits idle, and you'd pay for latency nobody experiences. Spend that budget on the database volume instead.
Local, Ceph and Networked NVMe for Hosting
| Option | Where data lives | Latency profile | Failure domain | Best fit |
|---|---|---|---|---|
| Local NVMe on bare metal | One server, whole machine | Lowest, no network hop | One host | Databases, game servers, large Proxmox nodes |
| Local NVMe VPS | Local disk on the hypervisor host | Low, shared with other tenants on the host | One host, shared with other tenants | Small sites, staging, low-write apps |
| Ceph replicated NVMe VPS | Replicas across several nodes | Low reads; writes wait for replica acknowledgement | Survives loss of a single node | General VPS hosting that needs resilience |
| Networked NVMe over Fabrics | Remote NVMe target | Depends on network; adds a round trip | Target and network path | Shared block storage for Proxmox clusters |
The Same Drive, Four Failure Domains
The delivery model matters as much as the drive. Our infrastructure uses NVMe SSD storage, but a local disk, a Ceph pool, and a remote target fail in completely different ways. Ask which pool a VPS sits on and whether replicas sit on separate nodes. If a provider can't answer that, you don't know what you're buying.
Local NVMe on bare metal is the latency floor. There's no network hop and no neighbor. ARPHost bare metal servers are single tenant and give customers the whole machine, so performance isn't shared. For sustained database or game server load, look at bare metal servers with local NVMe. The trade-off is blunt: if that host dies, the workload stops until you restore or fail over at the application layer.
Ceph trades write latency for survival. Ceph acknowledges a write only after replicas confirm, so write latency includes a network round trip, while reads may be served locally. You pay milliseconds on writes to survive losing a node. For clustered designs built that way, see Proxmox private clouds, and for a worked cluster example, read about migrating a mixed Windows and Linux cluster to Proxmox VE with Ceph.
NVMe Over Fabrics Is a Network Problem
A remote target connects like this.
sudo nvme connect-all -t rdma -a <target-ip>
sudo nvme list-subsys
sudo nvme list
Verify the subsystem appears, then check the kernel log. Treat connection loss as a storage path incident, not a local drive timeout. Don't mount the same namespace read and write from multiple hosts unless the filesystem and cluster design explicitly support it. In production, one bad fabric path can stall several guests at once, which looks like simultaneous disk failure until you check the network.
Checking NVMe Endurance, Health and Timeouts With nvme-cli
Endurance comes before speed. Drives carry TBW and DWPD ratings, and NAND survives a limited number of program and erase cycles. Garbage collection moves data internally, so write amplification means the drive writes more than the host asked for. TLC NAND endures fewer rewrites than SLC, so match the rating to the job: a write heavy database or mail queue needs a different drive than a read mostly site.
Triage a Live Timeout
Start by recording the kernel and pulling the log. Don't reboot first.
uname -r
sudo dmesg -T | grep -iE 'nvme|timeout|reset|abort|I/O error'
sudo nvme list
sudo nvme smart-log /dev/nvme0
sudo smartctl -x /dev/nvme0
A typical line looks like this.
nvme nvme0: I/O 259 QID 2 timeout, completion polled
That line can appear while SMART shows no media errors, a pattern documented in Linux kernel bug 208123, where a device can report healthy counters while timeouts, resets, or PCIe and VMD problems degrade service. Compare the controller named in the log with the nvme list output, then check whether Intel VMD is in use, since VMD related timeouts are documented in the kernel tracker.
NVMe SMART Fields to Check
| SMART field | Meaning | What to watch |
|---|---|---|
| critical_warning | Bit flags for spare capacity, temperature, reliability or read-only mode | Any non-zero value needs action |
| temperature | Composite drive temperature | Sustained high readings point to airflow or heatsink problems |
| available_spare | Remaining spare capacity as a percentage | A fall toward available_spare_threshold |
| percentage_used | Estimated share of rated endurance consumed | Trend over months; it is an estimate, not a deadline |
| data_units_written | Host writes in units of 1,000 blocks of 512 bytes | Compare with workload growth after converting to GB |
| media_errors | Media failures reported by the device | Any increase is an incident and a replacement candidate |
| num_err_log_entries | Entries in the device error log | A rising count alongside timeouts in dmesg |
| unsafe_shutdowns | Power losses without a clean shutdown | A rising count points to power or host instability |
The units trip people up. data_units_written counts units of 1,000 blocks of 512 bytes, so a value of 188161 is about 96.34 GB in decimal units. Don't mix decimal GB with binary GiB in wear reports, and don't treat percentage_used as a deadline. It's an estimate, so trend snapshots monthly.
Zero counters don't prove normal performance. A drive can throttle, reset, or fail slow with rising tail latency long before it raises a SMART flag.
Watch for fail slow behavior: await in iostat creeps up over weeks while every counter stays clean. Dedicated and VPS customers get secure remote access tools, real-time monitoring and insights, remote reboot through the client portal, and Knowledgebase access, which makes trending these values practical instead of forensic. Preserve smart-log and dmesg output before rebooting, because unsafe_shutdowns and error log counts correlate storage incidents with power events.
How to Benchmark and Migrate to NVMe Safely
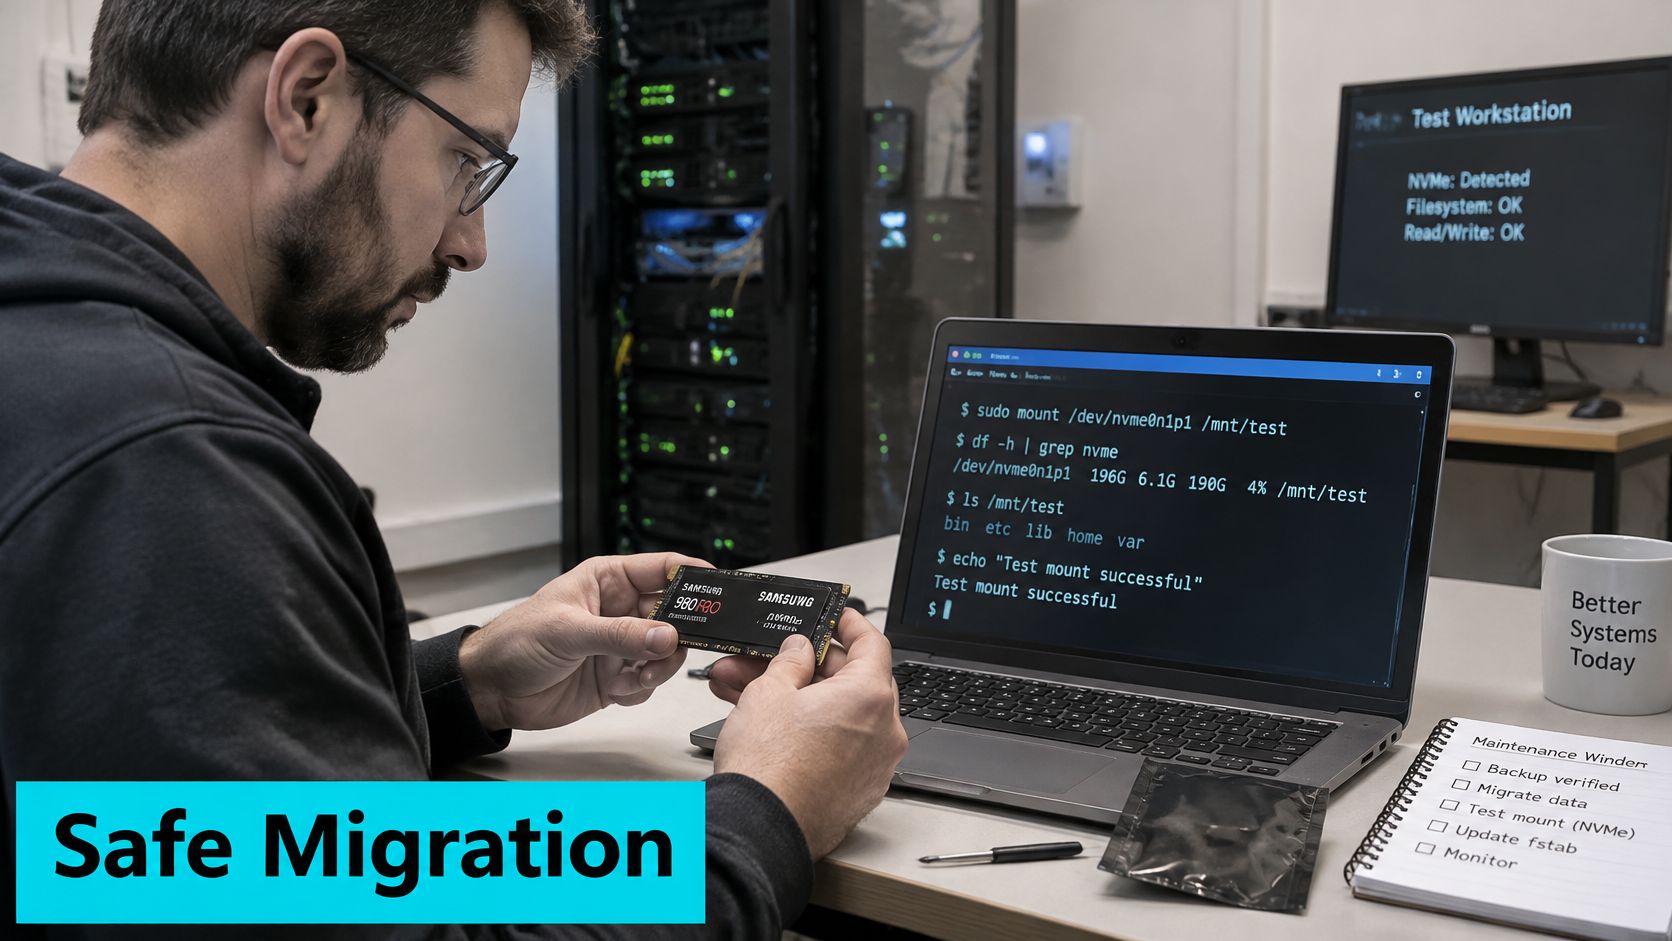
Before you touch anything, set a maintenance window, verify a backup you can restore, and prepare a test mount at /mnt/nvme on a formatted ext4 NVMe volume. Never benchmark against the production disk. Here's the drive handling side of the job.
Benchmark Before You Cut Over
- Capture the baseline. Save the health state so you can prove what changed.
sudo nvme smart-log /dev/nvme0 > /root/smart-before.txt
sudo dmesg -T | grep -iE 'nvme|timeout|reset' > /root/dmesg-before.txt
sudo nvme list
Match model and serial against the purchase record. A timeout here matters, because per Linux kernel bug 217871, timeout messages can occur even when the SMART log reports no media errors, and the two symptoms point to different faults.
- Run ten minutes of random I/O. Short tests only measure cache.
sudo fio --name=randrw --filename=/mnt/nvme/fio.dat --rw=randrw --rwmixread=70 --bs=4k --iodepth=32 --numjobs=4 --direct=1 --size=4G --runtime=600 --time_based --group_reporting
- Read the p99 latency. Compare the first minute with the last. A fall after sustained writes points to SLC cache exhaustion or throttling. Don't cut over yet, fix cooling or pick a different drive.
This walkthrough shows the mounting and verification flow end to end.
Copy, Verify, Cut Over
- Stop the service and copy the data.
sudo rsync -aHAX --info=progress2 /var/lib/mysql/ /mnt/nvme/
- Verify with a checksum dry run. Empty output means no differences.
sudo rsync -aHAXnc --itemize-changes /var/lib/mysql/ /mnt/nvme/
- Cut over through fstab. Unmount /mnt/nvme, move /var/lib/mysql to /var/lib/mysql.orig, create an empty mount point, add the UUID from blkid to /etc/fstab with noatime, then confirm the mount.
sudo blkid
sudo mount -a
findmnt /var/lib/mysql
- Start the service and compare SMART output with the baseline. New media errors or resets mean stop. The broader sequence fits a full server migration checklist if you're moving more than one service.
Rollback and Failure Modes
Keep the .orig directory until the workload runs cleanly. To roll back, stop the service, unmount, move .orig back into place, remove the fstab line, and restart. If timeouts appear during the copy, stop, drain write heavy work, collect logs, check VMD, and escalate rather than pushing through. In production, I would run a live pre-copy pass hours before the window, so the stopped pass only moves the delta and the outage stays short.
Confirm Your Storage Tier Before You Deploy
Match the tier to the I/O pattern and failure tolerance, not the headline speed. Confirm the transport, record a SMART baseline, and benchmark p99 latency before cutover. ARPHost offers VPS Hosting, Bare Metal Servers, and Colocation: choose VPS hosting for light sites, bare metal for sustained single tenant load, replicated private cloud where node loss can't stop service. Run the TRAN check first.
If your measurements point to local NVMe on dedicated hardware or replicated NVMe in a private cloud, ARPHost, LLC runs VPS, bare metal, and Proxmox private cloud infrastructure on NVMe storage from Tampa, Florida. Bring your iostat and smart-log output and we'll help you match the tier to the workload before you migrate.

Leave a Reply
You must be logged in to post a comment.