

A single ping of 20 to 40 ms doesn't prove an application is healthy. Run repeated tests, baseline the minimum off-peak RTT, then compare median, percentiles, jitter, loss, and behavior under load against the 100 ms RTT threshold used in FCC high-cost broadband performance rules.
The symptom is familiar: API calls stall, VoIP breaks up, a game rubber-bands, or a Proxmox console feels delayed while ping reports a comfortable number. On a shared 10Gbps link, the average can look clean while short queueing spikes interrupt interactive traffic.
Start with this baseline from Linux:
ping -c 20 -i 0.5 <destination>
mtr --report <destination>
mtr -P <tcp-port> -T -w <destination-ip>
For a loaded-path comparison, use evenly spaced UDP probes over a fixed 10-second window, then record minimum, mean, maximum, loss, and jitter. The rest of the investigation should answer one question: is the delay inherent to the path, or did congestion, retransmission, virtualization, or application setup add it?
Table of Contents
- Your App Feels Laggy Even Though Ping Looks Fine
- How to Design a Repeatable Latency Test That Actually Means Something
- Running the Tests Across LAN WAN Cloud and Colo With Real Commands
- Reading the Results Without Getting Fooled by Averages
- Why Latency Spikes Happen and How to Fix Each Cause
- Automate Monitoring and Use ARPHost Tailored Test Plans
Your App Feels Laggy Even Though Ping Looks Fine
That symptom usually means the test is measuring the wrong thing or summarizing it badly. A basic ICMP ping reports round-trip time for small probes. It does not show whether TCP connection setup, TLS negotiation, retransmissions, queueing under load, or uneven packet timing is delaying the application.
Run the three-command baseline from the introduction before changing firewall rules or moving workloads. Keep the results so you can compare the same path during normal and degraded conditions.
TCP and ICMP results answer different questions. ICMP can reveal path delay and loss, but routers, firewalls, and hypervisors may handle it differently from application traffic. A TCP probe to the service port tests a path closer to what users experience. If TCP latency rises while ICMP remains stable, inspect the firewall, load balancer, virtual switch, or service host instead of blaming the route. For a quick Linux reference, ARPHost's guide to ping for Linux covers basic command behavior.
What the first comparison tells you
Run the baseline during an off-peak period, save the output, then repeat it while the application is slow. Use the minimum sampled RTT as the inherent-delay baseline before throughput or congestion testing, as described in RFC 6349. Compare that baseline with the median, upper percentiles, maximum, loss, and jitter from the loaded run. The gap points toward queueing or contention, while a consistently high minimum points toward path distance or fixed processing delay.
For a fixed UDP probe window, use evenly spaced probes and retain the session statistics or packet capture. A practical capture command is:
sudo tcpdump -i any -nn -w latency-udp-baseline.pcap host <destination-ip>
Start the capture, run the 10-second probe, stop the capture, and store both files together. Keep the source, destination, protocol, packet size, and workload state consistent. A quiet ping from a gateway is not comparable with an application session crossing a firewall, load balancer, and virtual switch.
Production observation: On multi-tenant 10Gbps infrastructure, NVMe storage can finish local I/O quickly enough for network queueing to become the visible delay. A Proxmox VM may show a clean average RTT while a short burst from another tenant fills a queue, producing console lag or broken voice audio.
Reproduce the symptom, test the same destination and protocol, compare idle with loaded behavior, and preserve the evidence. If TCP or UDP disagrees with ICMP, treat the application protocol as the representative measurement.
How to Design a Repeatable Latency Test That Actually Means Something
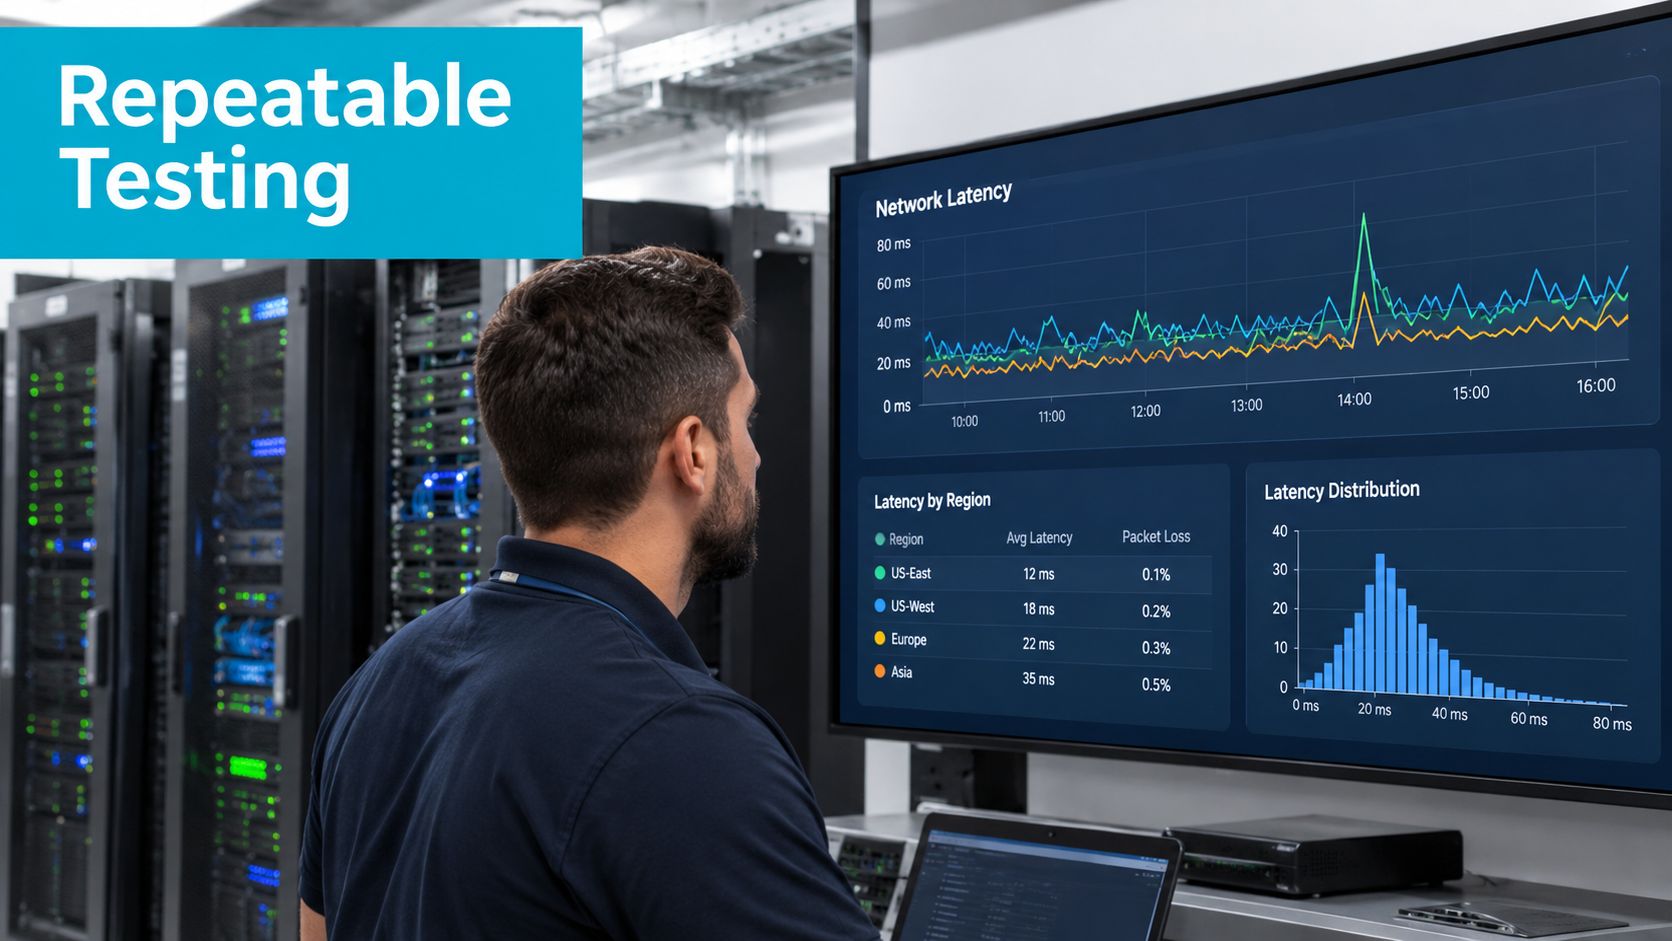
A useful latency test is a repeatable experiment, not a command run once from whichever shell is open. Record the source host, destination, interface, protocol, packet size, interval, test window, system time, route, and workload state. Without that context, two RTT values may describe different paths and different conditions.
Build the baseline first
Use small probes during an off-peak interval and retain the minimum sampled RTT as the inherent-delay baseline. RFC 6349 makes this distinction important because propagation and fixed processing delay shouldn't be confused with queueing delay created by load.
Prerequisites are modest:
- A Linux host with
iputils-ping,mtr,traceroute,iperf3, andtcpdump. - Root or capture privileges for packet traces.
- A destination you control, or explicit permission to test.
- A known TCP service port when testing application-like traffic.
- A firewall policy that permits the selected probes, or a documented reason for filtering.
On Debian or Ubuntu, verify the tools before starting:
command -v ping mtr traceroute iperf3 tcpdump
uname -a
ip route get <destination-ip>
The route output is part of the record. A path change can alter the baseline even when the server and command haven't changed.
Keep the test variables fixed
ICMP is useful for a quick path check, but TCP is usually more meaningful when the service is TCP based. UDP is useful for controlled probe intervals and for observing loss and delay under a defined load. Don't use one protocol as a substitute for all three.
Keep packet size and interval constant between runs. Repeat the test enough to expose normal variation. mtr report mode commonly starts with 10 packets, and increasing the cycle count improves the value of the result. For a longer diagnostic run, use 100 or more probes, or run for 10 to 15 minutes when investigating persistent loss, as described in the mtr command reference.
Save raw output instead of copying only the average:
mtr --report --report-cycles 100 <destination> | tee "mtr-$(date +%Y%m%d-%H%M%S).txt"
Discard warm-up probes that include connection setup when measuring an application session. TCP and TLS initialization can make the first readings unlike steady-state traffic. For each window, record minimum, maximum, median, selected percentiles, loss, and jitter. The arithmetic mean may be included, but it shouldn't be the only result.
Verify baseline stability before load
Run the same idle test at separate times, then compare the minimum and median rather than just the mean. If the minimum is stable but upper readings expand during traffic, the path is likely adding queueing delay. If the minimum itself changes, investigate routing, link state, or endpoint placement before testing throughput.
The FCC performance methodology uses small UDP packets for round-trip delay measurement, and its high-cost broadband rule requires at least 95% of latency measurements to be at or below 100 milliseconds RTT. That threshold is a useful operational reference, but application acceptance still depends on jitter, loss, and workload behavior.
Running the Tests Across LAN WAN Cloud and Colo With Real Commands
Use the same test sequence at every boundary. Start close to the source, then move outward: the local gateway, the WAN destination, the cloud service, and finally the remote colo host. This isolates the segment that changes when the symptom appears.
LAN testing on a Proxmox host
From a Proxmox VE host, test the default gateway and the target VM separately:
ip -br addr
ip route
ping -c 20 -i 0.5 <gateway-ip>
ping -c 20 -i 0.5 <vm-ip>
A healthy LAN result should show consistent replies with no loss. If the host-to-VM path is clean but the VM-to-WAN path is not, inspect the bridge, VLAN, firewall, and uplink rather than blaming NVMe latency or the guest disk.
For a path view:
traceroute -n <destination-ip>
mtr --report --report-cycles 100 <destination-ip>
Check the physical interface and bridge counters while reproducing the problem:
ip -s link show <interface>
bridge link
On a busy virtualization host, also check CPU scheduling and steal time inside the guest. A network symptom can begin as host contention, especially when several VMs compete for CPU and the virtual NIC doesn't get scheduled promptly.
WAN and ISP testing
Test the gateway, an ISP-side destination, and the actual application endpoint. Don't use a public target as the only control because its route and policy may change.
ping -c 20 -i 0.5 <isp-destination>
mtr --report --report-cycles 100 <application-host>
mtr -P <tcp-port> -T -w <application-ip>
When ICMP is filtered or deprioritized, TCP mode gives a more relevant view:
mtr -P 443 -T -w <destination-ip>
Compare idle results with a loaded test. iperf3 requires a server under your control:
iperf3 -s
iperf3 -c <iperf-server-ip> -t 10 -P 4
Run the throughput test separately from the latency test, and capture both timestamps. A large increase in RTT during iperf3 indicates queueing or bufferbloat. A clean RTT with poor throughput points elsewhere, such as shaping, retransmission, or endpoint limits.
Cloud VPS testing
From each VPS, test the other VPS by private address when possible, then by public address. The two paths can traverse different controls.
ping -c 20 -i 0.5 <peer-ip>
mtr --report --report-cycles 100 <peer-ip>
mtr -P 22 -T -w <peer-ip>
Capture retransmissions at the sending endpoint:
sudo tcpdump -i any -nn -s 128 -w vps-peer.pcap host <peer-ip>
Open the capture in Wireshark and inspect TCP retransmissions, duplicate acknowledgments, and changes in advertised receive windows. A VPS with fast NVMe storage can still feel slow when the application waits on a remote database or when the virtual network path is congested.
Colo to colo paths
For colo to colo testing, use matching hosts, matching packet sizes, and the same service port at both sites. Record whether traffic uses a private circuit, public transit, or an overlay.
ping -c 20 -i 0.5 <remote-colo-ip>
mtr --report --report-cycles 100 <remote-colo-ip>
mtr -P 443 -T -w <remote-colo-ip>
iperf3 -c <remote-colo-ip> -t 10 -P 4
A Tampa to Florida regional path can still show different behavior by provider and route. Compare the actual route and loaded results rather than assuming geographic proximity guarantees low jitter.
| Test Goal | Recommended Command | What It Reveals |
|---|---|---|
| Quick RTT check | ping -c 20 -i 0.5 <destination> | Per-probe RTT, loss, and a basic summary |
| Per-hop path review | mtr --report --report-cycles 100 <destination> | Per-hop loss, sent and received counts, best, average, worst, and standard deviation |
| Application-like TCP path | mtr -P 443 -T -w <destination-ip> | TCP-specific path behavior when ICMP differs or is filtered |
| Load impact | iperf3 -c <server> -t 10 -P 4 | Throughput and the latency change under traffic |
| Packet-level evidence | tcpdump -i any -nn -w test.pcap host <destination-ip> | Retransmissions, duplicate acknowledgments, and packet timing |
Reading the Results Without Getting Fooled by Averages
Latency results answer different questions. RTT measures send-and-return delay. Jitter describes variation between readings. Packet loss shows delivery failure, but it doesn't tell you whether the missing packets were isolated, bursty, or caused by a test device suppressing responses.
A report with a good mean can still describe a poor user experience. If most readings are low and a small group contains severe spikes, the arithmetic average hides the exact events that interrupt voice, remote desktop, storage traffic, or game state updates.
Use percentiles for interactive workloads
ITU-T G.1051 recommends reporting the 50th percentile as the median and using the 10th percentile as an approximation of the shortest reachable latency. It doesn't recommend relying on the arithmetic mean because extreme values can dominate it.
For a one-hour window, a practical summary can exclude the top 1% of samples when producing a stable operational view, while retaining those samples separately for incident analysis. That gives you two perspectives: the normal distribution and the rare spikes that matter.
Compute jitter as the mean absolute difference between consecutive latency readings:
jitter = mean(abs(rtt[n] - rtt[n-1]))
Don't confuse this with the maximum spike. A path can have a low average difference and still contain a single event large enough to disrupt a call.
Separate stable delay from spike-like jitter
A useful result set includes:
| Metric | Question it answers | Operational meaning |
|---|---|---|
| Minimum RTT | What is the path's inherent delay? | Baseline for propagation and fixed processing |
| Median RTT | What does a typical exchange experience? | Better central value than the arithmetic mean |
| 10th percentile | How short can reachable latency be? | Approximation of the low-delay floor |
| Upper percentile | How often does delay inflate? | Detects queueing and burst behavior |
| Jitter | How uneven are consecutive readings? | Predicts instability for voice and interactive traffic |
| Loss | Are packets failing to arrive? | Points toward congestion, filtering, or link faults |
The FCC uses 100 milliseconds RTT as a policy-backed performance threshold for its high-cost broadband testing. Treat it as a compliance and screening reference, not as a universal application target. VoIP and interactive control paths can fail on jitter and loss even when RTT remains below that number.
A stable CDN edge path can look excellent in a dashboard while rare spikes still make a login, voice stream, or game session feel broken.
If the median and minimum are stable but upper percentiles expand under load, investigate queues. If all values rise together, inspect route changes, distance, endpoint processing, or a service-side bottleneck. If only TCP is affected, look at handshake timing, retransmissions, firewall policy, and the application port.
Why Latency Spikes Happen and How to Fix Each Cause
Most incidents I see on shared infrastructure start with contention, not exotic routing theory. The order below reflects what tends to deserve attention first when a multi-tenant link, Proxmox cluster, or remote service develops intermittent lag.

Congestion and bufferbloat
If idle RTT is stable and loaded RTT rises sharply, find the queue. Run iperf3 while repeating the latency probe, then inspect switch, router, and host interface counters.
iperf3 -c <server-ip> -t 10 -P 4
ping -c 20 -i 0.5 <destination-ip>
ip -s link show <interface>
The fix is usually capacity or queue management: shape the busy egress, apply a tested QoS policy, move bulk transfers outside interactive periods, or give latency-sensitive traffic an appropriate class. Change one control at a time. Roll back by restoring the previous QoS or shaping configuration, then rerun the idle and loaded baselines.
The ARPHost latency troubleshooting guide is a useful adjacent reference when the first tests point to congestion rather than a broken endpoint.
Protocol treatment and firewall policy
ICMP can be filtered, rate limited, or deprioritized. Compare it with TCP on the port the application uses:
mtr --report <destination>
mtr -P 443 -T -w <destination-ip>
sudo tcpdump -i any -nn host <destination-ip>
If TCP shows consistent behavior while ICMP reports suspicious loss, don't declare the path broken from ICMP alone. If both show delay, inspect firewall CPU, connection tracking, QoS rules, and inspection features. Roll back the last policy change and retest from both directions.
Path changes and peering
A changed hop sequence or altered upper-percentile RTT can indicate routing or peering movement. Save reports from both endpoints and compare timestamps, destinations, and protocols. A provider can investigate only when you supply reproducible evidence, including source, destination, port, time window, loss, percentiles, and captures.
Florida routes can vary by transit and destination. A Tampa facility with redundant power and multiple Tier 1 providers may offer alternate paths, but redundancy doesn't eliminate the need to identify which path carried the affected flow.
Virtualization contention
On Proxmox VE, compare host-to-guest, guest-to-gateway, and guest-to-remote results. Check host load and interface counters while the problem occurs:
pveversion -v
uptime
top
ip -s link
If only one guest is affected, inspect its vNIC, firewall, CPU allocation, and bridge configuration. If several guests spike together, check the host uplink, bridge, physical switch, and scheduling pressure. Move a test workload to a controlled host only after preserving the original evidence. Revert the migration if the symptom doesn't follow the workload.
Retransmissions and retry cascades
Latency spikes can trigger retransmissions, and retries can create more load. Capture the session and inspect TCP behavior:
sudo tcpdump -i any -nn -s 128 -w retransmissions.pcap host <destination-ip>
RFC 1122 defines concrete TCP RTT and retransmission timeout behavior, including an initial RTO of 3 seconds, with retransmission thresholds tied to R1 and R2. That explains why a short network event can become a much longer application stall. Fix the underlying loss or queueing first. Increasing application timeouts may mask the symptom without repairing the path.
Fiber, cable, and DSL can behave differently under load, but the medium alone doesn't identify the fault. Congestion, retransmissions, and application behavior often determine the result, so test idle and loaded states before replacing hardware.
Escalate when the same issue reproduces from multiple hosts, persists across controlled protocols, or shows physical errors and loss at a shared boundary. Give the upstream or remote-hands team timestamps, MTR reports, TCP results, interface counters, and packet captures. Don't send only “ping is high.”
Automate Monitoring and Use ARPHost Tailored Test Plans
Manual testing finds an incident. Scheduled testing shows whether the baseline is drifting. Store raw results with timestamps, route identity, source host, destination, protocol, and workload state. Feed parsed values into Prometheus or Grafana, then alert on upper-percentile RTT, jitter, and loss rather than mean RTT alone. ARPHost's infrastructure monitoring guidance fits this operational model.
A simple cron entry can preserve MTR evidence:
*/5 * * * * /usr/bin/mtr --report --report-cycles 100 <destination> >> /var/log/mtr-destination.log 2>&1
For a scheduled ping sample:
*/5 * * * * /bin/ping -c 20 -i 0.5 <destination> >> /var/log/ping-destination.log 2>&1
Use three test plans:
| Path | Idle test | Loaded test | Verification |
|---|---|---|---|
| VPS to VPS | Ping, MTR, TCP MTR | iperf3 between controlled peers | Compare median, upper percentile, jitter, and loss |
| Bare metal to Proxmox cluster | Host, bridge, guest, and remote tests | Controlled VM-to-host throughput | Confirm the spike follows the path, not one guest |
| Colo to colo over 10Gbps links | Matched TCP and ICMP reports | Parallel iperf3 sessions during an approved window | Preserve reports and packet captures for SLA review |
If automation produces false alerts, roll back by disabling the timer or cron entry, retain the collected logs, and adjust thresholds only after reviewing the raw distribution. For teams running NVMe-heavy databases, dense virtualization, or private cloud traffic, a controlled dedicated host can make the test boundary easier to isolate. ARPHost, LLC provides bare metal, VPS, Proxmox private cloud, colocation, and managed infrastructure services, so the same methodology can be applied across those environments.
ARPHost, LLC supports latency-focused troubleshooting across VPS, bare metal, Proxmox private clouds, colocation, and managed infrastructure. Visit ARPHost, LLC to discuss a repeatable test plan, path evidence, and operational monitoring for your workloads.

Leave a Reply
You must be logged in to post a comment.