

47.1 million DDoS attacks were mitigated by Cloudflare in 2025, averaging about 5,376 attacks per hour, so detection has to classify traffic in real time rather than wait for a long outage. The practical fix is to enable flow telemetry, set per-destination packet-per-second thresholds with a silence threshold, and alert before blocking.
The symptom usually looks ordinary at first: sudden latency, packet loss, rising load on a firewall, or a flood of SYN or UDP hits in a VPS host's interface counters. On multi-tenant bare metal, the harder cases are quieter. One tenant sees slow HTTP requests, another sees connection resets, and the upstream interface shows a steady rise that never crosses a single-host threshold.
Start by measuring packets per second by destination instead of staring at aggregate bandwidth:
sudo nload -m eth0
sudo tcpdump -ni eth0 'ip or ip6' -c 10000
sudo ss -Htan state syn-recv | wc -l
nload gives you a quick interface view. tcpdump confirms whether the traffic is TCP, UDP, or mixed. ss helps identify local TCP state pressure, but it isn't a DDoS detector by itself.
A publicly disclosed Cloudflare attack reached 31.4 Tbps in December 2025 and lasted only 35 seconds, according to the Cloudflare 2025 fourth-quarter DDoS report. A detector that samples too slowly or waits for human confirmation can miss the useful response window entirely.
This guide treats DDoS attack detection as an operational precision problem. The objective isn't to block every unusual burst. It's to identify suspicious deviation, enrich it with flow and application context, and hand a reliable event to mitigation without taking a legitimate tenant offline. If you operate customer workloads, 24/7 server monitoring should provide the alert path, while the detector supplies the evidence.
Table of Contents
- Your Traffic Just Spiked and You Need to Know If It Is a DDoS
- How DDoS Detection Actually Works Under the Hood
- Signature Versus Behavioral Versus Entropy Methods Compared
- Telemetry Sources That Make Detection Reliable
- Setting Thresholds Metrics and Alerts That Do Not Drown You in Noise
- A Practical Detection Workflow and Monitoring Architecture
- Tuning for Stealthy Attacks and Knowing When to Escalate
Your Traffic Just Spiked and You Need to Know If It Is a DDoS
Start with the observed symptom
The alert may say packet loss detected, connection timed out, or SYN_RECV count rising. A switch may report an interface nearing capacity. A customer may only say that the website is slow. Treat each as a symptom, not proof of an attack.
The first checks should answer three questions:
- Is one destination receiving the traffic, or are many tenants affected?
- Is the increase concentrated in packets, bytes, flows, or HTTP requests?
- Did the traffic arrive from many sources with a coordinated protocol or port pattern?
Run a short header capture during the event:
sudo timeout 10 tcpdump -ni eth0 -tt 'tcp[tcpflags] & tcp-syn != 0' -c 200
sudo timeout 10 tcpdump -ni eth0 -tt 'udp' -c 200
A SYN-heavy result with few completed connections points toward connection-state pressure. UDP alone doesn't prove malicious traffic. DNS, game, voice, and telemetry workloads can all produce legitimate UDP bursts.
Check per-destination pressure
On Linux, conntrack and socket counters show host impact, but the cleanest production view normally comes from NetFlow, sFlow, or IPFIX exported by the edge switch. If you need a local approximation, use tcpdump and count destination addresses:
sudo timeout 10 tcpdump -ni eth0 -nn 'ip' 2>/dev/null
  | awk '{print $5}'
  | sed 's/.[0-9]*$//'
  | sort | uniq -c | sort -nr | head
Expected output will resemble this:
  18420 203.0.113.20
   2310 203.0.113.21
    844 203.0.113.22
The addresses above are illustrative output, not a prescribed configuration. In a real facility, the collector should group by the actual destination address, service port, protocol, interface, tenant, and routing prefix.
A vendor implementation can declare an attack when packets per second to a destination exceed a configured threshold. It can also log the end only after traffic falls below three-fourths of that threshold and remains there for 5 seconds, as documented in H3C's DDoS packet-rate configuration guide.
Production observation: On shared hardware, a single aggregate interface graph is rarely enough. The useful alert names the destination, tenant or VM, protocol, port, and first-seen time, so the operator can act without guessing which customer is affected.
Don't block on the first threshold crossing. Alert first, compare the event with the tenant's normal profile, then apply a narrowly scoped mitigation if the evidence agrees. That sequence prevents a product launch, backup window, or game-server event from becoming a self-inflicted outage.
How DDoS Detection Actually Works Under the Hood
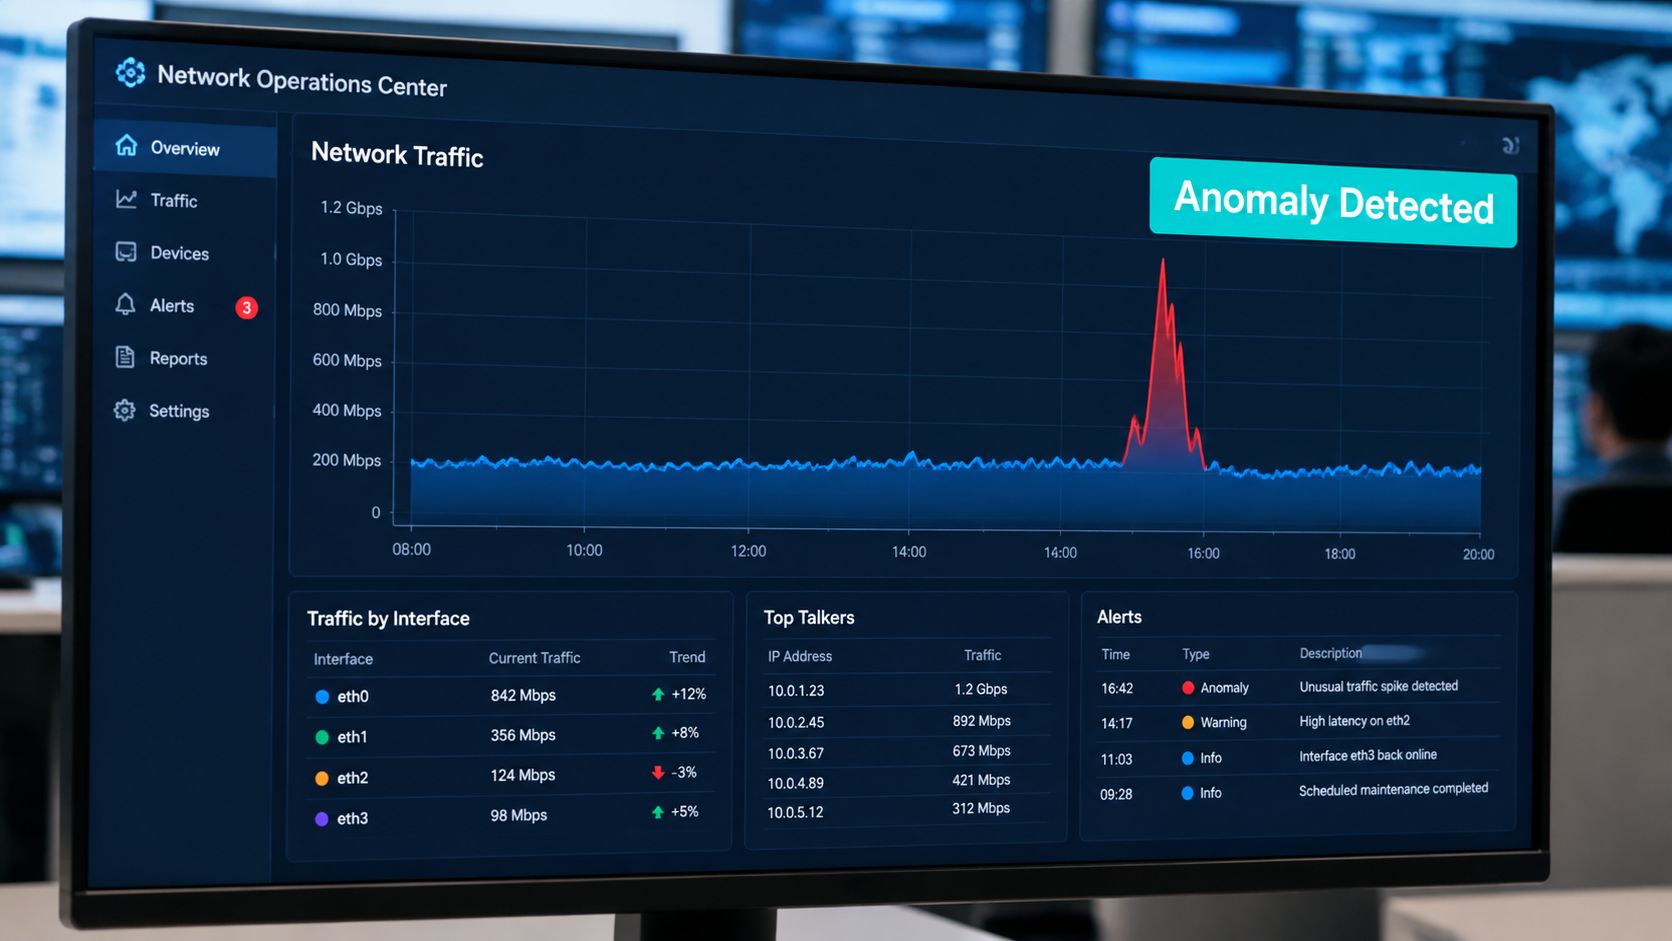
DDoS detection starts with a baseline. The detector records normal ranges for packets per second, bits per second, flow counts, connection behavior, protocol mix, and destination concentration. It then compares the current time window with that normal operating band.
Baselines are more useful than one global number
A global threshold treats a quiet mail server and a busy API node as identical. They aren't. A useful baseline is scoped to the destination, service, protocol, interface, and time pattern. It should also distinguish normal scheduled events from unexpected bursts.
Think of entropy as traffic distribution rather than raw volume. On a highway, traffic can increase while remaining naturally distributed across many exits. During a coordinated event, vehicles may suddenly concentrate around one exit. Network entropy captures a similar shift across source IPs, destination IPs, ports, protocols, or packet sizes.
Entropy-based detection monitors the randomness of flow features such as source IP, destination IP, source port, destination port, protocol, and packet size. Research collected in the National Library of Medicine study on entropy-based DDoS detection describes how those values can move outside a normal band during attacks.
A sharp drop in destination-IP entropy often means traffic is concentrating on fewer victims. Source-IP or source-port entropy can rise when many bots distribute traffic across the service. Neither signal should stand alone, because legitimate traffic can also become concentrated during a popular event.
Correlation turns an anomaly into an incident
A detector should combine several observations:
- Rate: Packets or bytes exceed the destination's normal band.
- Distribution: Destination entropy falls, or source diversity changes abruptly.
- Protocol behavior: SYN packets, UDP payloads, or HTTP requests dominate unexpectedly.
- State response: New connections rise without corresponding completed sessions.
- Application effect: Error rates, request latency, or worker saturation increase.
Detection means raising a well-described suspicion. It doesn't automatically mean the traffic is malicious or that the system should block it.
This distinction matters operationally. F5's DDoS reporting example describes threshold crossings as log messages for the DDoS operator, with traffic above the configured rate treated as suspicious rather than automatically malicious.
Application-layer detectors can add HTTP GET counts, entropy, and entropy variance per connection. The Entropy journal research on entropy and sequential testing describes combining entropy with lightweight statistical methods, which is useful when full payload inspection is too expensive. The result is a detector that can react quickly while preserving an operator's ability to validate the event.
Signature Versus Behavioral Versus Entropy Methods Compared
No single detection family covers a multi-tenant network well. Signature matching is fast when the traffic resembles a known flood. Behavioral baselining catches changes that weren't described in advance, but it needs clean history and sensible scope. Entropy exposes distributional shifts that simple rate counters miss.
Choose the method by the failure you need to catch
Signature detection compares traffic with known patterns. A SYN flood, UDP amplification pattern, or malformed protocol sequence may trigger quickly. The weakness is familiar: a new variation, encrypted application traffic, or a low-rate event can look unlike the stored signature.
Behavioral detection asks whether current traffic differs from the normal profile for a host, service, tenant, or interface. It works well for identifying unusual connection ratios, request rates, and protocol changes. It can also create noise after a workload changes, such as a new application release or a customer migration.
Entropy detection measures the distribution of traffic features. It can identify concentration on a small destination set or an unusual change in source diversity. It needs a stable baseline and can mislead operators if they don't account for planned events.
| Detection Method | Primary Signal | Strength | Limitation | Best Use Case |
|---|---|---|---|---|
| Signature matching | Known packet, protocol, or flow pattern | Fast response to recognized floods | Misses novel or deliberately altered traffic | Common SYN, UDP, and protocol attacks |
| Behavioral baselining | Deviation from normal host or service behavior | Adapts to different tenants and workloads | Requires tuning and reliable history | Low-and-slow pressure and changing traffic profiles |
| Entropy analysis | Distribution changes across flow features | Detects concentration and source diversity shifts | Sensitive to baseline quality and aggregation scope | Multi-source attacks and destination concentration |
Use layered evidence instead of voting blindly
A practical policy might alert when packet rate rises and destination entropy falls, then raise severity when application latency or failed connections also increase. That is stronger than allowing any one condition to trigger a block.
For example, a web tenant with a sudden request increase may be experiencing a legitimate campaign. If request volume rises while successful responses, source distribution, and outbound response traffic remain normal, an automatic block is risky. If requests become repetitive, entropy drops, connection completion falls, and workers saturate, mitigation becomes more defensible.
For packet inspection and known-pattern validation, Snort's software overview is a useful adjacent reference. Snort can contribute signature visibility, but it shouldn't carry the entire detection workload at a saturated edge. Flow telemetry and application metrics provide broader context with less per-packet processing.
In practice, signature rules are the fast tripwire, behavior is the tenant-aware baseline, and entropy is the distribution check. Use all three where the telemetry supports them, but keep the final action tied to service impact and confidence.
Telemetry Sources That Make Detection Reliable
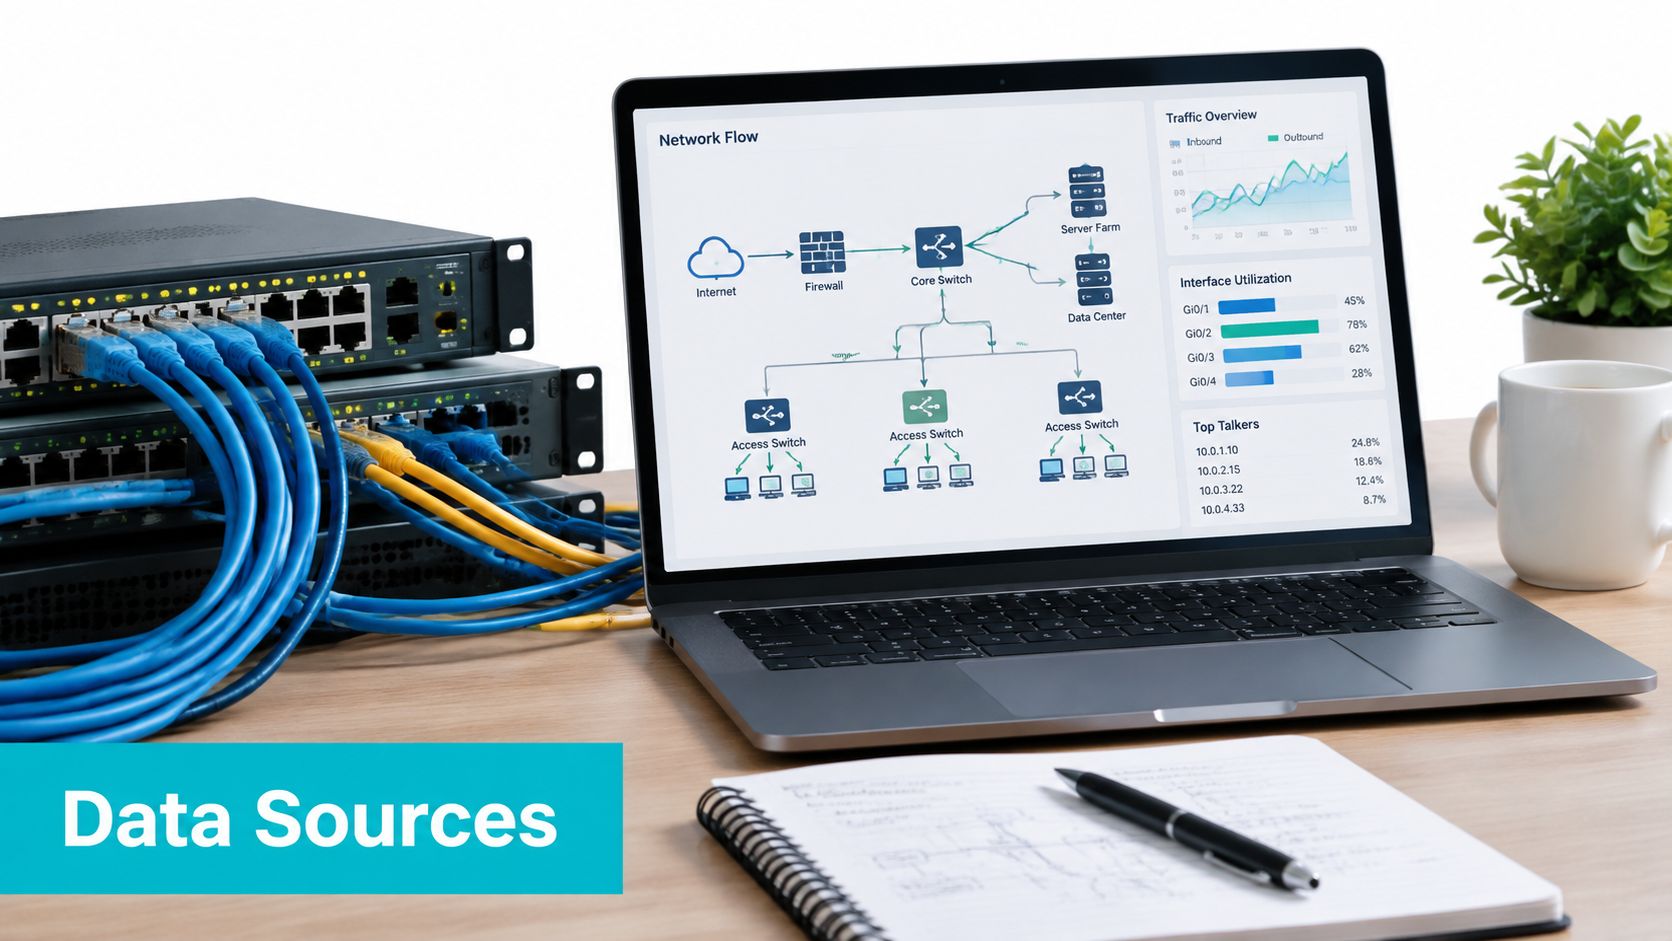
Detection quality follows telemetry quality. A host-level packet counter can tell you that the interface is busy, but it can't reliably explain whether one tenant, an entire prefix, or an upstream link is absorbing the pressure.
Collect flow records at the edge
NetFlow, sFlow, and IPFIX expose source and destination addresses, ports, protocols, counters, interfaces, and time windows. NetFlow and IPFIX generally provide summarized flow records. sFlow samples packets and combines them with interface counters, which reduces collection overhead but requires care when interpreting small events.
A Linux host can expose useful local evidence with ip, ss, and nstat:
ip -s link show dev eth0
nstat -az | egrep 'Tcp|Udp|Ip'
ss -s
A representative result might look like this:
Tcp:
  1280 active connections openings
  742 passive connection openings
  96 failed connection attempts
  410 connections established
  1240 segments received
  1398 segments sent
Udp:
  890 packets received
  130 packets to unknown port
Use the values as a time-series comparison, not as an isolated verdict. A high packet count with normal application completions means something different from a high packet count paired with failed connections and rising latency.
Add packet and application context
Packet captures help classify headers, flags, packet sizes, and protocol mix. Full captures are expensive during an incident, so use short captures or sampled headers and send detailed data only when a flow alert warrants it.
Application logs expose events that network flow records can't see. For Nginx, inspect request status, request rate, upstream timing, and repeated paths:
sudo tail -n 100 /var/log/nginx/access.log
sudo awk '{print $9}' /var/log/nginx/access.log
  | sort | uniq -c | sort -nr
DNS telemetry adds another layer. A reflection event can show unusual query or response patterns, while a DNS water-torture style event may distribute requests across many names. Correlating DNS activity with flow records is more reliable than blocking based on a single resolver or source range.
Correlate by tenant and infrastructure layer
On Proxmox, collect interface and bridge counters at the host, then associate the traffic with the VM or container. At the edge, group by destination, service port, and routing prefix. At the application tier, join the same time window to HTTP status and latency data.
Server performance monitoring tools can help operators keep host saturation, storage wait, and network counters in the same operational view. This matters on bare metal because a network event may first appear as CPU interrupt pressure or softnet backlog rather than application load.
Production observation: Sustained traffic across a Proxmox node can look like a guest problem until the host's bridge, interrupt handling, and uplink counters are checked together. The tenant ID and physical interface belong in the alert payload.
Setting Thresholds Metrics and Alerts That Do Not Drown You in Noise
Thresholds should answer a specific operational question: which destination, service, or aggregation point is receiving more traffic than its normal profile can absorb? A single facility-wide packet limit is easy to configure and nearly useless for a mixed hosting environment.
Configure rate thresholds by scope
Start with per-destination packet and byte rates. Add service-level and prefix-level aggregation for carpet bombing, where each address can remain below its individual threshold while the shared link degrades.
Use a detector configuration that makes the action explicit:
detector:
  interval: 1s
  dimensions:
    - destination_ip
    - protocol
    - destination_port
  metrics:
    packets_per_second:
      alert_above: baseline_plus_threshold
    bits_per_second:
      alert_above: baseline_plus_threshold
    destination_entropy:
      alert_below: normal_lower_bound
  action: alert
  recovery:
    traffic_fraction: 0.75
    quiet_period: 5s
This is a policy example for a detector that supports those fields, not a universal configuration format. The important choices are the one-second measurement window, scoped dimensions, entropy lower bound, alert-only first action, and hysteresis during recovery.
An entropy detector can flag a window when calculated entropy falls significantly below the normal mean. The Springer research on entropy thresholds in SDN detection describes the threshold as a lower bound, which is a useful way to think about concentration events.
Prevent flapping and false positives
Use separate trigger and recovery conditions. If an alert fires at one rate and clears at the same rate, normal jitter can create repeated open and close events. Requiring traffic to stay below three-fourths of the detection threshold for 5 seconds provides practical hysteresis, as documented in the H3C implementation referenced earlier.
Keep the first response as an alert unless the traffic is already causing measurable harm. Include the following fields in the event:
- Scope: Destination, tenant, VM, interface, prefix, protocol, and port.
- Evidence: Current rate, baseline rate, entropy value, source count, and application impact.
- Timing: First observed, last observed, and recovery time.
- Action: Alerted, rate-limited, diverted, or blocked.
Verify the policy with a controlled test or a replay of sanitized headers. Confirm that a legitimate burst raises an alert without triggering a block, while a known test pattern reaches the expected severity.
Roll back a noisy policy
Remove or disable the newest rule rather than changing several thresholds at once:
sudo cp /etc/ddos-detector/policy.yaml /etc/ddos-detector/policy.yaml.bak
sudoedit /etc/ddos-detector/policy.yaml
sudo systemctl reload ddos-detector
sudo journalctl -u ddos-detector -n 50 --no-pager
If reload fails, restore the backup and restart only after validating syntax:
sudo cp /etc/ddos-detector/policy.yaml.bak /etc/ddos-detector/policy.yaml
sudo systemctl reload ddos-detector
Common failures include baselining during an incident, aggregating only by destination IP, treating sampled sFlow as an exact packet counter, and sending every threshold crossing directly to an automated block.
A Practical Detection Workflow and Monitoring Architecture
A workable architecture separates collection, analysis, decision, and mitigation. That separation keeps the detector responsive even when a mitigation device or application tier is under pressure.
Place sensors where the evidence changes
At the edge, flow exporters reveal interface saturation, destination concentration, and source distribution. At the core or hypervisor layer, counters show whether traffic is affecting a bridge, VM, or physical uplink. At the application tier, logs confirm whether requests are reaching workers and whether users are receiving successful responses.
Internet
   |
Edge router and flow exporter
   |
Flow collector and time-window detector
   |--------------------> SIEM or alerting
   |
Core switch and host interfaces
   |
Proxmox bridge, VPS, bare metal service
   |
Application logs and API telemetry
   |
Mitigation handoff
Run the workflow in order
Collect a clean baseline. Record traffic by destination, protocol, port, tenant, and interface during representative operating periods. Exclude known maintenance and backup windows from automatic learning.
Score short windows. Calculate packet rate, byte rate, flow count, source diversity, destination concentration, and entropy. Keep the window short enough to catch brief bursts, but don't treat one sample as an incident.
Enrich the event. Join network evidence with HTTP status, request paths, DNS behavior, socket state, CPU softirq pressure, and customer impact. A detector that says only
traffic highcreates work instead of removing it.Alert before mitigation. Send a structured event to the SIEM or incident system. Automatic rate limiting can be appropriate for a narrowly scoped service, while broader blocking should require stronger correlation.
Hand off to mitigation. Depending on capacity and architecture, the action may be an ACL, rate limit, FlowSpec rule, RTBH decision, or upstream scrubbing request. Preserve the original flow evidence so the response can be reviewed.
Verify recovery. Confirm that the destination rate, entropy, application latency, error rate, and host counters return toward baseline. Don't close the incident merely because one graph declined.
Match hardware to the workload
High-throughput flow collection and local analysis can fit on virtual infrastructure, but dense multi-tenant visibility may justify dedicated CPU, memory, and NIC capacity. Proxmox private clouds are useful when collectors need isolation and flexible placement. Dedicated hardware is more suitable when packet processing, capture, or high-rate aggregation competes with tenant workloads.
ARPHost operates colocation services and bare metal servers in Tampa, Florida, where local remote hands and regional connectivity can matter for teams that need physical access or a lower-latency regional deployment. Keep the sensor close to the traffic boundary it must observe. A detector placed after an already saturated link can't protect the link it never sees.
Test the workflow with legitimate load, a controlled protocol test, and a simulated application burst. The verification target isn't merely that an alert fired. It is that the alert identified the right tenant and service, preserved legitimate traffic, and gave the operator a mitigation decision with enough evidence to act.
Tuning for Stealthy Attacks and Knowing When to Escalate
Low-and-slow traffic needs different controls from a large flood. DigiCert reported that 73% of observed attacks were below 0.5 Gbps, and that over 97% were unique-style attacks, according to its mid-2025 data as cited in the verified industry coverage. Those figures make a simple bandwidth trigger a poor primary detector for hosting providers.
Track request completion, connection duration, source rotation, destination concentration, DNS behavior, API paths, and application worker pressure. A multi-vector event may combine modest UDP traffic with SYN pressure and repetitive HTTP requests. Correlation helps distinguish a real service attack from a flash crowd or a misconfigured client.
Measure detection by operational outcomes:
- Time from first anomalous window to a useful alert.
- Time from alert to mitigation.
- Customer-visible latency and error behavior.
- False-positive alerts during planned traffic changes.
- Recovery time after mitigation.
Escalate when the event threatens the uplink, affects multiple tenants, persists across vectors, or exceeds the capacity of local controls. Hand the upstream provider a concise packet of evidence, including affected prefixes, protocols, rates, timestamps, entropy changes, application symptoms, and actions already taken.
For recurring incidents, maintain per-service baselines, review policies after migrations, and keep a tested handoff runbook. Local filtering can't restore capacity that has already been consumed upstream, so early escalation is part of detection, not a separate afterthought.
ARPHost, LLC provides colocation, bare metal, VPS, Proxmox private clouds, secure hosting, and managed infrastructure with DDoS monitoring and mitigation workflows. If your team needs help correlating flow data, tenant telemetry, and response actions, visit ARPHost, LLC and discuss the detection path with its infrastructure team.

Leave a Reply
You must be logged in to post a comment.