

At 3 AM, nobody cares that the monitoring dashboard is green at the top level. They care that checkout is timing out, email has stopped flowing, or a line-of-business app won’t load. That’s the moment when the phrase “24/7 server monitoring service” either means real operational coverage or turns out to mean an alert was emailed into a queue that nobody will read until morning.
That gap is where most buying mistakes happen. Teams assume “always monitored” means “someone is actively ready to respond.” Often, it doesn’t. A real service combines telemetry, thresholds, escalation logic, and a human process that can isolate the fault and start remediation before users pile into support channels.
For businesses running revenue-generating systems, this isn’t a nice-to-have. It’s part of uptime engineering, cost control, and risk management.
What Is 24/7 Server Monitoring Really
A real 24/7 server monitoring service starts before the outage. It watches for the conditions that usually show up first: CPU pressure that never drops back to baseline, RAM exhaustion, storage issues, rising temperatures, service failures, DNS dependency problems, or application checks that begin to slow before they fail.
That’s why mature teams treat monitoring as a business continuity system, not just a dashboard. The service market itself reflects that shift. The website and server monitoring services market is projected to grow at a 14% CAGR through 2033, and the managed services portion already represents a $1.9 billion segment, which shows how much demand has moved from software-only tooling to human-backed response (website and server monitoring services market outlook).
The 3 AM test
The simplest way to define monitoring is to use the 3 AM test.
If a database process crashes overnight, what happens next?
- Bad answer: a tool sends an email.
- Better answer: an alert opens in an incident system and pages the on-call engineer.
- Correct answer: the issue is validated, triaged, and worked immediately according to a runbook.
That difference matters because plenty of failures aren’t dramatic at first. A fan starts failing. Temperature rises. The node stays online for a while. Then instability starts showing up in places that look unrelated. Good monitoring catches the early signal. Good operations teams act on it.
Practical rule: If your provider can’t explain who looks at a critical alert outside business hours, you don’t have true around-the-clock coverage.
There’s also a broader reliability mindset here. In industrial environments, teams invest in predictive maintenance solutions because waiting for visible failure is expensive. Server infrastructure works the same way. The tooling is different, but the principle is identical. Detect degradation early, respond before service impact, and reduce the blast radius when something breaks.
The Core Components of an Effective Monitoring Service
A monitoring stack that effectively helps operations has three layers: collection, interpretation, and action support. If one of those is weak, the whole service becomes noisy or blind.
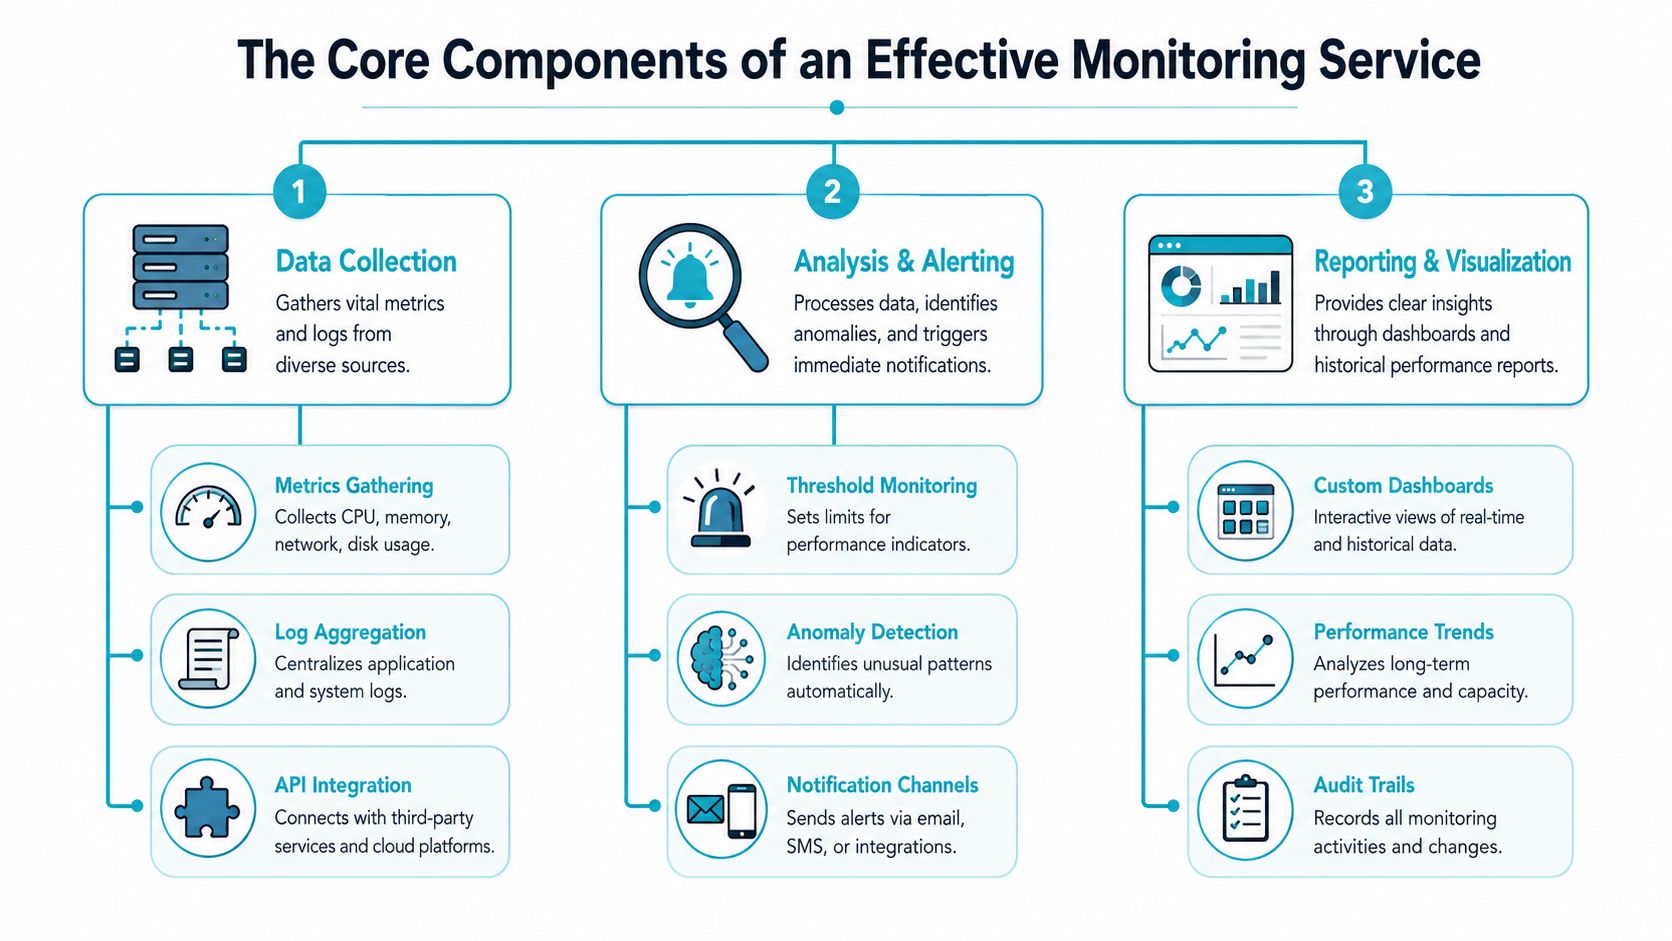
Start with layered checks
The first mistake I see is relying on shallow checks. Ping has a place, but ping only tells you a host responds on the network. It doesn’t tell you whether HTTP is serving the right status code, whether mail services are healthy, whether DNS dependencies are behaving, or whether a custom application port is returning anything useful.
An effective service should cover these layers:
| Layer | What to monitor | Why it matters |
|---|---|---|
| Infrastructure | CPU, RAM, disk usage, storage health, temperature | Finds hardware strain and capacity problems early |
| Service | HTTP, SMTP/POP/IMAP, DNS, custom ports | Verifies the thing users depend on is actually available |
| Platform | Windows, Linux, VMware, IIS, SQL Server, Exchange | Catches stack-specific faults that generic tools miss |
| Dependency | Databases, external APIs, DNS chains | Exposes upstream issues before they look like app bugs |
Thresholds need tuning, not guesswork
Thresholds should reflect system behavior, not vendor defaults. A batch-processing server that spikes nightly shouldn’t page someone every night. A web node that normally runs cool but suddenly shows a sharp temperature change needs attention fast.
Historical review is what separates useful alerting from noise. Effective monitoring should analyze 30 to 90 days of trends and use regular heartbeat checks to catch conditions like a failing fan that shows up as a sudden temperature increase (Splunk server monitoring guidance).
That’s why mature teams review:
- Recurring spikes: expected jobs versus abnormal sustained load
- False alarms: thresholds that fire often but never require action
- Missed conditions: incidents that happened without a useful alert
- Time-based behavior: what deserves paging at night versus a morning ticket
Good monitoring separates infrastructure metrics from application metrics. If CPU is calm but response time is bad, the problem probably isn’t the hypervisor.
Reporting has to support decisions
Dashboards are useful, but historical reporting is where operations improve. You want enough visibility to answer basic questions quickly:
- Did the service fail, or just slow down?
- Did the host run out of memory, storage, or network headroom?
- Did this happen once, or has it been building for weeks?
- Is the same pattern repeating after patch cycles, backups, or deploys?
If the service can’t answer those questions, it’s collecting data without producing operational clarity.
Key Business Benefits of Proactive Monitoring
Technical teams usually buy monitoring for visibility. Businesses keep paying for it because it changes the economics of downtime.
Organizations using continuous monitoring report up to 60% faster incident response and a 40 to 70% reduction in downtime, while building an in-house 24/7 team for an SMB can exceed $30,000 per month That’s the core business case in one line. Faster response, less downtime, and lower operating cost than staffing every shift yourself.
Where the savings show up
The direct cost of an outage is only one part of the damage. The hidden costs usually hit harder:
- Interrupted revenue: checkout, booking, payment, or customer portal failures
- Internal labor burn: engineers stop planned work and switch into incident mode
- Customer trust loss: users remember instability longer than teams expect
- Compliance exposure: missed alerts and weak logs create audit headaches
For smaller teams, the staffing math is brutal. Building around-the-clock internal coverage means nights, weekends, rotations, burnout risk, and uneven skill coverage. A managed service shifts that from payroll overhead into a predictable operating model.
Cost control versus false economy
Cheap monitoring plans often look attractive because the monthly line item is smaller. The problem is that they usually cut the expensive part, which is after-hours human attention. That makes the service look efficient on paper while leaving the business exposed when a critical alert hits overnight.
A more useful buying lens is this: compare the service cost to the cost of one serious production interruption. That usually changes the conversation quickly.
For teams weighing whether managed support is worth it, this breakdown of managed service provider benefits is a practical starting point because it frames monitoring as part of a wider support and operational resilience model, not a standalone tool purchase.
Monitoring pays for itself when it prevents one outage from becoming a multi-team firefight.
Monitoring vs Remediation The Critical Distinction
At 3:07 AM, a database server hits 100% disk usage. Monitoring-only service means an alert lands in a queue and waits for business hours or an on-call contact who may be asleep, unreachable, or unfamiliar with the system. Monitoring with remediation means an engineer logs in, finds the growth source, frees space safely or expands capacity if approved, checks database health, and confirms the application is stable.
That is the buying line that matters.
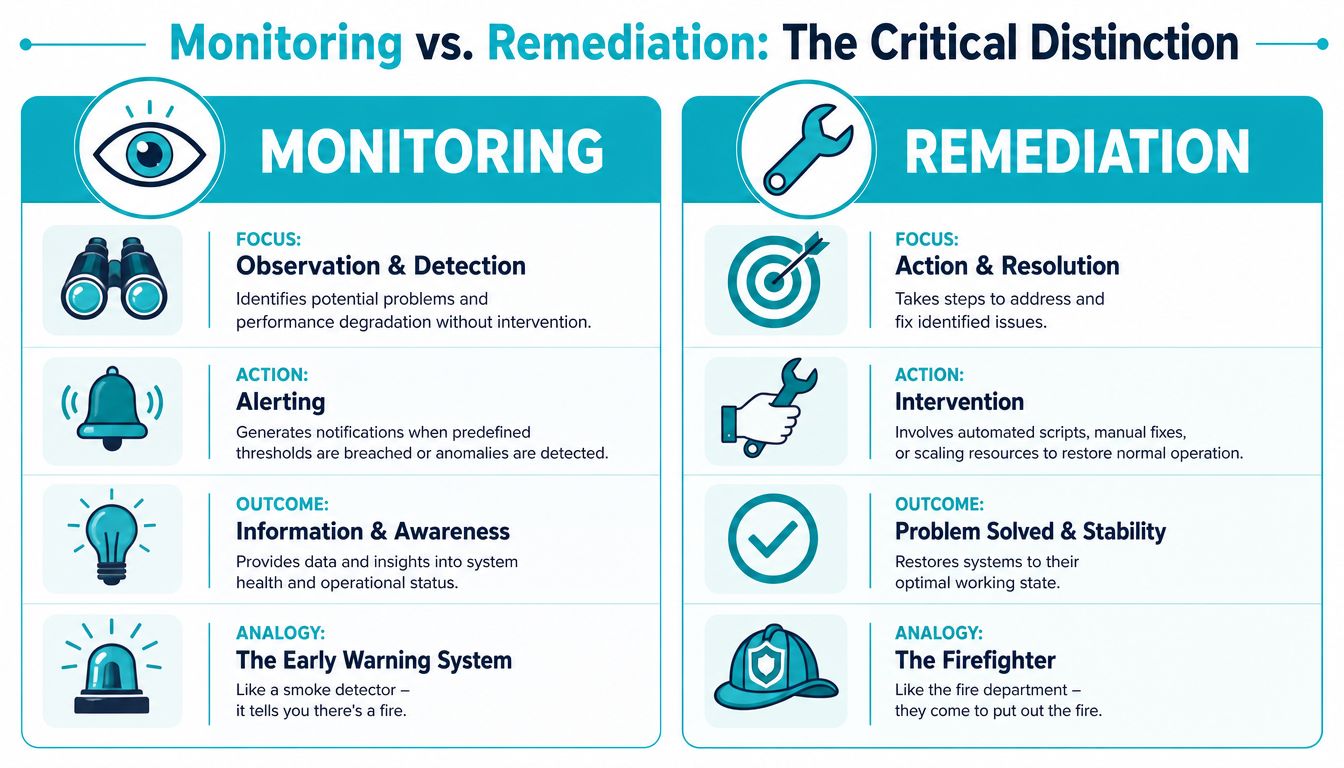
Many providers sell “24/7 monitoring” when the service stops at detection. An agent watches metrics, raises an alert, and opens a ticket. As Managed Ops explains in its guide to monitoring versus remediation, real 24/7 coverage includes human response and immediate technical action, not just notification.
Teams often miss this distinction because dashboards make both services look similar. CPU graphs, availability checks, and ticket counts can all appear healthy in a sales demo. The difference shows up during the first overnight incident.
Side-by-side reality
| Scenario | Monitoring only | Monitoring with remediation |
|---|---|---|
| Disk fills overnight | Alert generated | Alert generated and engineer investigates cause |
| Web service stops | Ticket created | Service checked, restarted if appropriate, dependencies verified |
| Node becomes unstable | Warning sent | Triage begins, failover or containment steps considered |
| Backups fail repeatedly | Dashboard changes color | Team traces job failure and validates recovery path |
A good way to test a provider is to ask what tool creates the alert, then ask who owns the first 15 minutes after that alert. If the answer stays focused on software, you are buying detection. If the answer includes access, runbooks, escalation paths, and verification, you are closer to a managed response model. Many of the tools involved fall under remote monitoring and management software, but the software alone does not restore service.
What real remediation includes
A service that handles incidents instead of forwarding them usually includes:
- Severity-based response: critical failures are routed differently from warnings, including nights, weekends, and holidays
- Documented runbooks: approved steps for common faults such as failed services, full disks, stuck backup jobs, or failed cluster nodes
- Pre-approved access: engineers can log in without waiting through a permission chain during an outage
- Change judgment: someone decides whether restart, failover, rollback, or containment is the safer action
- Post-fix validation: the team confirms the application, dependency, and user path are working again
Automation still has a place. Auto-restarting a known-safe service or triggering a failover can reduce recovery time. But automation has limits. It does not investigate why a process died twice in one hour, whether a storage path is flapping, or whether restarting a queue worker will duplicate jobs and create a larger problem.
Why this matters in procurement
The contract language matters more than the dashboard.
Ask the provider one plain question: when a production alert fires at 3 AM, does a qualified engineer begin work immediately, or does the system only notify someone? Then ask what actions that engineer is authorized to take without waiting for approval. Those two answers tell you whether you are paying for monitoring or for operational coverage.
Why ARPHost is relevant here
ARPHost Fully Managed IT Services is one example of a provider model that includes server management and 24/7 support as part of a broader managed operations service. For buyers, that distinction matters because ownership of the response path determines whether an alert becomes a resolved incident or an unattended ticket.
How to Choose the Right 24/7 Monitoring Provider
Buying on features alone is how teams end up with attractive dashboards and weak incident handling. The better approach is to evaluate the provider the same way you’d evaluate an operations partner.
Ask for the operating model, not just the tool list
A provider should be able to explain, in plain terms, what happens from alert to resolution.
Ask these questions:
Who receives critical alerts after hours?
You’re looking for a named process, not “our system creates a notification.”What counts as remediation?
Some providers mean ticket creation. Others mean active troubleshooting.How are priorities assigned?
Critical app failures, degraded storage, and warning-level resource issues shouldn’t all follow the same path.What evidence do you get after an incident?
You want timestamps, actions taken, and verification notes.
Validate backup recoverability
This is one of the most overlooked items in server monitoring contracts. Backup completion is not the same as backup usability. A green status on a job report doesn’t prove the recovery point is valid.
That gap is costly. Analysis cited by Fantastic IT says 68% of SMBs that suffered a ransomware attack could not recover from backups because integrity had never been validated, despite dashboards appearing healthy (backup recoverability versus backup completion).
Don’t ask only whether backups are monitored. Ask whether recoverability is verified and how that verification is documented.
A provider that monitors only completion can still leave you exposed to silent corruption, missing systems, bad retention assumptions, or restore procedures nobody has tested.
Match the provider to your operating style
Not every environment needs the same service model.
- Unmanaged infrastructure fits teams that want root control and already have in-house operational depth.
- Co-managed support fits teams that want help with after-hours coverage, backups, patching, or escalation.
- Fully managed service fits organizations that want a provider to own routine care and urgent response.
For teams comparing tooling and service layers, this primer on what RMM software is helps separate the software platform from the human processes around it. That distinction matters. Good RMM software supports operations. It doesn’t replace them.
Watch for practical fit
The right provider should also fit your stack and hosting model. If you run VPS instances, KVM workloads, Proxmox nodes, shared web apps, or dedicated bare metal, ask whether the monitor set changes by platform. It should. A one-size-fits-all template usually misses the failure modes that matter most.
A decent buying checklist includes:
- Coverage depth: infra, services, dependencies, backups
- Response clarity: who acts, when, and with what access
- Reporting quality: useful post-incident detail, not just alert counts
- Platform fit: Linux, Windows, virtualization, storage, application stack
- Commercial fit: managed, unmanaged, or hybrid service model
Example Workflow Monitoring a Proxmox HA Cluster
Proxmox is a good example because it makes the difference between monitoring and remediation obvious very quickly. In a high-availability environment, you don’t just care whether a node is reachable. You care whether quorum is intact, corosync is stable, shared resources are healthy, and workloads can move cleanly under failure.
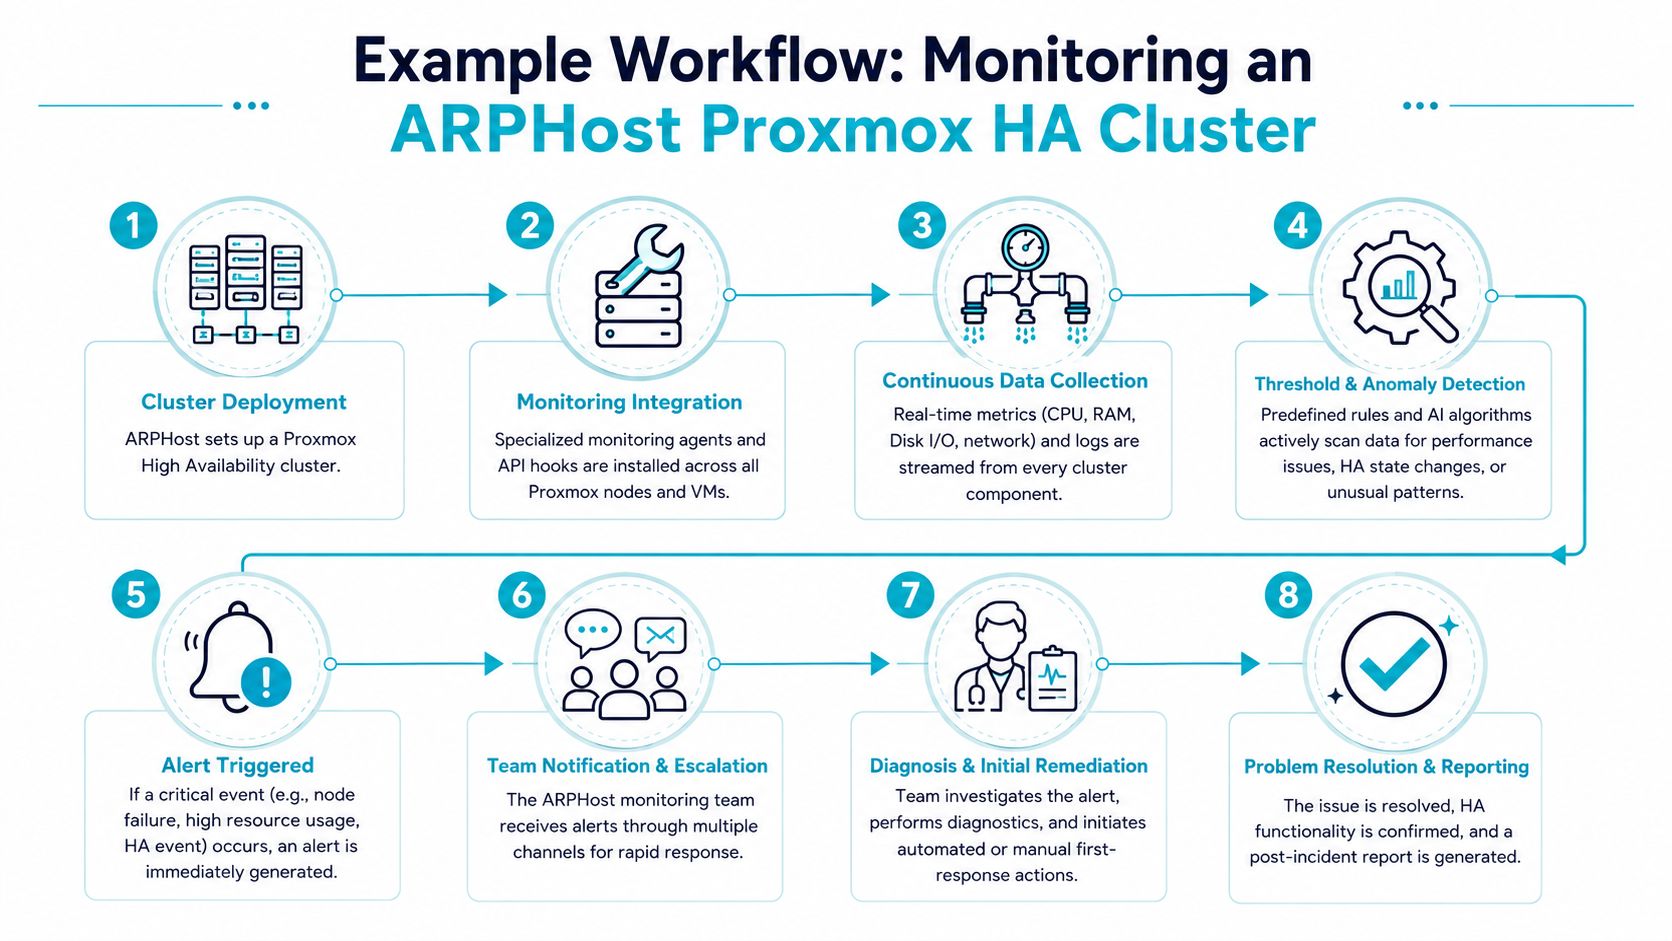
For Proxmox VE 9 high availability, you need a minimum of three nodes for quorum, and best practice is to isolate corosync traffic on a dedicated interface so heartbeat traffic doesn’t compete with VM or storage traffic (Proxmox HA cluster best practices).
A practical alert-to-action runbook
A simple workflow looks like this:
Baseline deployment
Build the cluster with quorum in mind. For production, many teams prefer more fault tolerance than the minimum design.Separate the traffic types
Management, VM, storage, and corosync traffic should not all fight over the same path.Monitor the right signals
Watch node health, storage state, HA events, guest status, and latency-sensitive cluster communication.
Here’s the kind of command set an admin might use during validation and triage:
pvecm status
ha-manager status
qm list
pct list
journalctl -u corosync
That tells you whether you still have quorum, whether HA resources are in the expected state, and whether corosync is showing instability.
A quick architecture sketch helps clarify the goal:
- Node A, Node B, Node C: hypervisor cluster members
- Dedicated corosync network: isolated heartbeat path
- Shared storage or aligned replication design: supports workload continuity
- External monitoring layer: observes host, guest, service, and HA event state
- Human escalation path: validates whether failover succeeded cleanly
The hardware choice matters too. A cluster node intended for dense virtualization has different monitoring needs than a small single-tenant box. A Dual Intel Xeon E5-2690 V3 dedicated server is a sensible fit for Proxmox cluster work and multi-tenant virtualization, while an AMD EPYC 4584PX system suits memory-heavy databases and high-density virtualization. For single-tenant application hosts or development environments, an AMD Ryzen 9600X can be the cleaner choice.
What remediation looks like in this scenario
Now take a real failure pattern. One node stops responding. Monitoring catches the state change. HA attempts to recover protected workloads. That is not the end of the incident. Someone still needs to confirm whether the failover completed, whether storage remained healthy, and whether the underlying fault is network, power, hardware, or kernel-related.
This walkthrough on Proxmox high availability hosting is relevant if you’re designing that sort of stack and need to think beyond VM placement into actual operational coverage.
For a visual walkthrough, this video is useful:
Frequently Asked Questions About Server Monitoring
Is a small VPS worth monitoring 24/7
Yes, if it runs something users or staff depend on. Even a modest VPS can host a payment page, business email workflow, customer portal, or production API. The smaller the team, the more valuable after-hours visibility becomes because there’s usually nobody watching manually.
Does monitoring include backups automatically
Not always. Some providers watch for job completion only. Stronger services also verify whether recovery points are usable. That’s a critical distinction for ransomware planning and disaster recovery.
Do I need managed service if I already have alerts
Alerts are only one part of the chain. If your team can’t respond overnight, doesn’t have tested runbooks, or doesn’t want on-call fatigue, managed response closes that gap.
What should web hosting customers look for
Look for service checks that go beyond host reachability. You want visibility into website availability, mail flow, security events, backup status, and application performance. For simpler website stacks, secure managed VPS hosting or secure web hosting bundles can make more sense than building your own monitoring stack from scratch.
Is this only for large clusters
No. The same principles apply to a single dedicated server, a VPS fleet, or a Proxmox private cloud. The tooling changes. The operational discipline doesn’t.
If you need infrastructure that can be operated either hands-on or fully managed, ARPHost, LLC offers VPS hosting, secure web hosting bundles, bare metal servers, Proxmox private clouds, colocation, instant applications, and managed services with 24/7 support. You can start small with VPS hosting, review bare metal servers, explore Proxmox private clouds, or request a managed services quote if you need monitoring tied to actual remediation.